
Figures & data
Table 1. Description of the data categories listed under each item in our database.
Table 2. Data fitting of age values and their absolute errors for various methods.
Figure 1. Scatter plots of average absolute error for various methods: (a) All methods age(206Pb/238U); (b) All methods age (207Pb/235U); (c) All methods age (207Pb/206Pb); (d) All methods age(208Pb/232Th); (e) LA-ICP-MS Age(206Pb/238U); (f) LA-ICP-MS Age (207Pb/235U); (g) LA-ICP-MS Age (207Pb/206Pb); (h) LA-ICP-MS Age (208Pb/232Th); (i) SHRIMP Age (206Pb/238U); (j) SHRIMP Age (207Pb/235U); (k) SHRIMP Age (207Pb/206Pb); (l) SHRIMP Age (208Pb/232Th); (m) SIMS Age (206Pb/238U); (n) SIMS Age (207Pb/235U); (o) SIMS Age (207Pb/206Pb); (p) SIMS Age (208Pb/232Th). Fitted curves are shown in each plot.
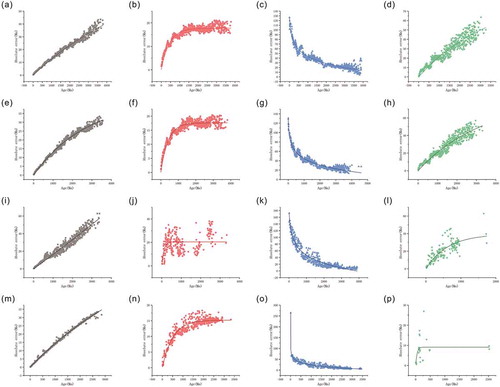
Table 3. Recommended radiometric method for different age intervals.
Figure 2. Comparison of fitted curves for different radiometric ages: (a) all methods; (b) LA-ICP-MS; (c) SHRIMP; (d) SIMS.
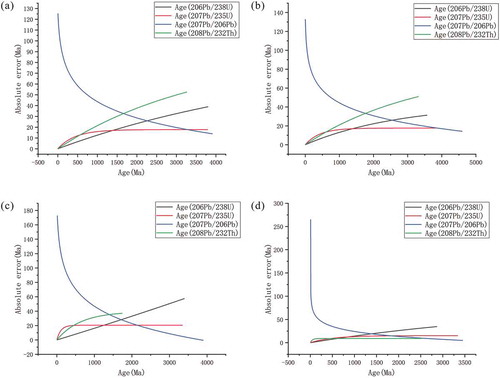
Table 4. Appropriate age intervals of different U-Pb radiometric methods for dating.
Figure 3. Comparison of minimum standard error related to the recommended radiometric age for different measurement methods.
Figure 4. Age frequency histogram and Gaussian multi-peak fitting curves showing seven main peaks for all continental Chinese U-Pb geochronology data in the Elsevier science database (peak at 835.95Ma is not decomposed in this case).
Table 5. Gaussian multi-peak fitting results of the age frequency histograms for all Chinese U-Pb geochronology data.
Figure 5. Age frequency histogram and Gaussian multi-peak fitting curves showing eight main peaks for all continental Chinese U-Pb geochronology data in the Elsevier science database (peak at 835.95Ma is decomposed into two superimposed peaks in this case).

Figure 6. Age frequency histogram and Gaussian multi-peak fitting curves for all continental Chinese Cenozoic Pb-U geochronology data in the Elsevier science database.
Figure 7. Regional distribution of 95.45% confidence intervals for zircon peak growth ages, representing various high-frequency peaks in age. (a) 48.60 Ma;(b) 131.49 Ma;(c) 249.91 Ma;(d) 444.27 Ma; (e) 835.95 Ma; (f) 1860.65 Ma; (g) 2505.54 Ma.
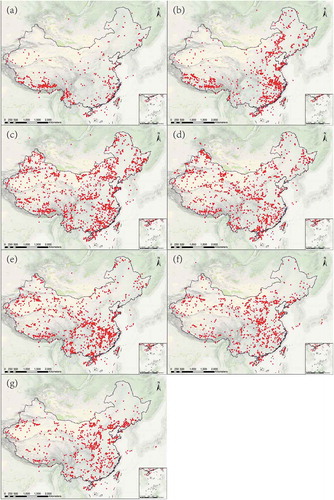
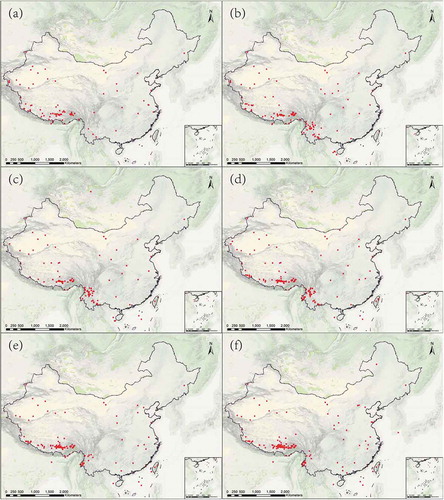
Figure 8. Regional distribution of 95.45% confidence intervals for zircon peak growth ages within the Cenozoic era, representing high-frequency peaks for ages: (a) 16.55 Ma; (b) 27.74 Ma; (c) 35.24 Ma; (d) 42.70 Ma; (e) 51.61 Ma; (f) 61.47 Ma.
Data availability statement
The data referred to in this paper is not publicly available at the current time.