Figures & data
Figure 1. Some classical basalt tectonic environment discrimination maps commonly used in the literature (according to Liu et al., Citation2017). (a) TiO2-MnO-P2O5(Mullen, Citation1983); (b) Ti/Y-Nb/Y (Pearce, 1982); (c) V-Ti (Shervais, Citation1982); (d) Ta-Th-Nb(Ta) (Wood, Citation1980); (e) Th/Yb-Ta/Yb (Pearce, 1982).
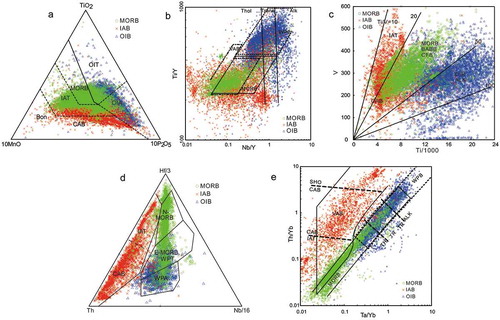
Figure 2. Discrimination diagrams for tectonic settings of basalts. (a) Sc × 10/Sr vs. Ga/Nb; (b) Nb/Y vs. K2O × 100/Cu; (c) Sr/V vs. Na2O × 100/Ga; (d) Y/La-Nb/Yb-Th/Ta; (e) Ba/Nb-La/Ta-Sr/Y; (f) Ba/Nb-Li/Ta-Sr/Y.
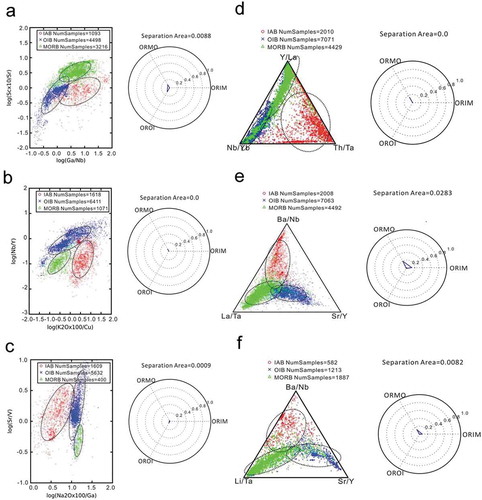
Figure 3. Sc × 10/Sr vs. Ga/Nb,Nb/Y vs. K2O × 100/Cu and Sr/V vs. Na2O × 100/Ga tectonic environment discrimination diagrams for basalt.