
Figures & data
Table 1. Technical data of most prominent remote sensing missions.
Figure 1. Project area depicting the generalized lithostratigraphic settings based on Geological Map (Gansu Bureau of Geology and Mineral Resources (GBGMR), Citation1987) with underlying shaded relief produced in 2012.
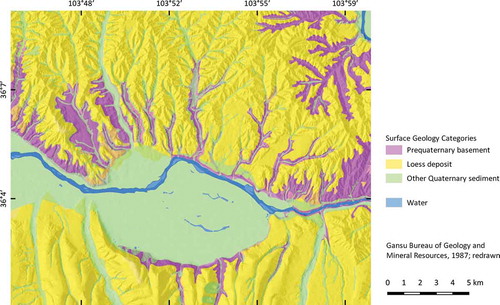
Figure 2. Classification steps of changed areas, illustrated on PC2 from image stack 2013–10-11 to 2015–10-10: a) Selected greyscale coded PC containing the changes; b) Binning statistics of the factor values with 2nd and 98th percentiles representing changes; c) Mapping of the changed areas according to the binning statistics.
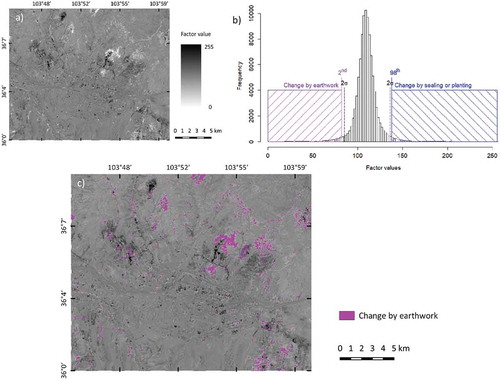
Table 2. Landsat scenes included in the study.
Figure 3. Analysis flow chart.
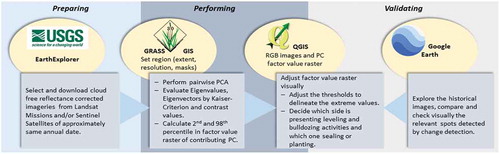
Table 3. Important PCs, eigenvalues, loadings of the eigenvector for corresponding six bands, importance, and contrast C; the utilized PCs are in bold.
Figure 4. Changed areas in time intervals and validation spots; depicted on the Sentinel-2 scene [11/01/2016] (Natural colors: RGB bands 4, 3, 2). The city area is excluded.
![Figure 4. Changed areas in time intervals and validation spots; depicted on the Sentinel-2 scene [11/01/2016] (Natural colors: RGB bands 4, 3, 2). The city area is excluded.](/cms/asset/876cbdda-32b4-44eb-9a19-cd0f02a5218d/tbed_a_1640412_f0004_c.jpg)
Figure 5. The proportion of the leveled and bulldozed area in the respective periods.
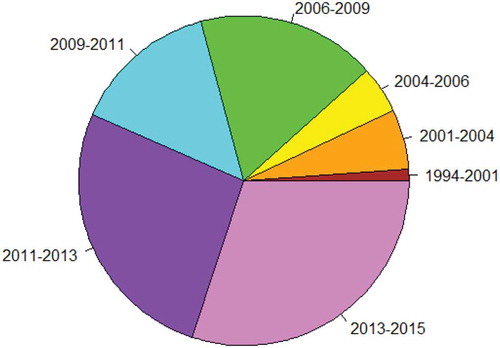
Figure 6. Taipingyang development zone, July 2017, a) leveling and b) terracing work to generate construction land.
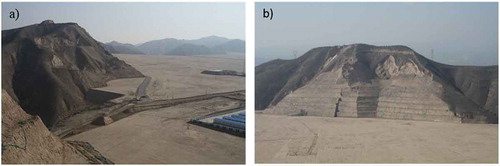
Figure 7. a) Housing community in the Biguiyuan development zone, 27–04-2016, b) Commercial building district and housing community in the Jiuzhou development zone, 26–04-2016.
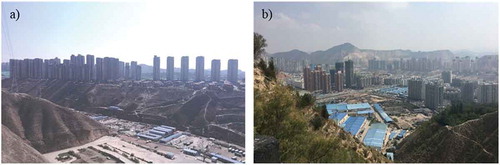
Figure 8. Example of a visual check with Google Earth, showing leveling activities in Biguiyuan development zone in 2002–2004: a) Factor values of the change detection between the scenes Oct 2001 – Oct 2004. b) The beginning phase of earthworks in 2002 [11/25/2002]; c) Shape of the development area in November 2004 [11/04/2004]. Differences in the brownish hues indicate the leveling area in the center of the picture.
![Figure 8. Example of a visual check with Google Earth, showing leveling activities in Biguiyuan development zone in 2002–2004: a) Factor values of the change detection between the scenes Oct 2001 – Oct 2004. b) The beginning phase of earthworks in 2002 [11/25/2002]; c) Shape of the development area in November 2004 [11/04/2004]. Differences in the brownish hues indicate the leveling area in the center of the picture.](/cms/asset/0a3ea4b8-8083-411b-a4b9-59b9edf810ad/tbed_a_1640412_f0008_c.jpg)
Figure 9. Elevation difference classes on the validation spot Taipingyang a) elevation in 2012, b) elevation in 2016, c) cutting and filling difference classes depicted on a Sentinel-2 scene [11/01/2016] (Natural colors: RGB bands 4, 3, 2).
![Figure 9. Elevation difference classes on the validation spot Taipingyang a) elevation in 2012, b) elevation in 2016, c) cutting and filling difference classes depicted on a Sentinel-2 scene [11/01/2016] (Natural colors: RGB bands 4, 3, 2).](/cms/asset/5311e5a7-d14d-46eb-a139-553266d905b7/tbed_a_1640412_f0009_c.jpg)
Data availability statement
Derived data supporting the findings of change detection study are available from the corresponding author on request. Restrictions are given for the compared elevation models due to contract.