
Figures & data
Figure 1. eBird checklist locations and occurrence locations of T. migratorius in June 2012.
Figure 2. BBS routes and occurrence locations of T. migratorius in June 2012.
Figure 3. T. migratorius occurrence locations (eBird) filtered using a 50 km × 50 km grid.
Figure 4. L functions of the observation efforts and the T. migratorius occurrence locations.
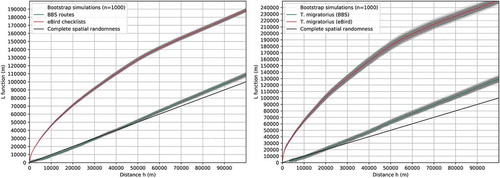
Figure 5. Probability density surfaces of the observation efforts and the T. migratorius occurrence locations.
Figure 6. Distribution maps of the T. migratorius predicted using Maxent based on the original occurrences and the filtered occurrences.
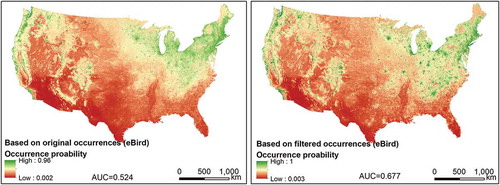
Table 1. Impact of the filtering grid size on SDM model performance.
Data availability statement
The data referred to in this paper is not publicly available at the current time.