
Figures & data
Table 1. Global datasets used for producing the fused land cover dataset.
Table 2. Target classification scheme defined to adapt major life forms and leaf attributes.
Table 3. Definition example of affinity scores for input class and “Trees”.
Table 4. Definition example of affinity scores for input classes and “cropland”.
Table 5. Definition example of affinity scores for input classes and target class than are not “Trees” nor “Cropland”.
Figure 1. Principle of a decision-fuse method used in this study.
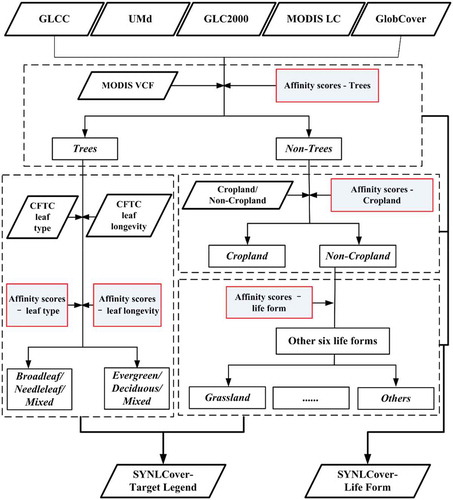
Table 6. Calculation example for the best estimate of other life forms.
Table 7. Decision matrix for leaf type (below diagonal) and leaf longevity (above diagonal) in case two leaf classes receive the same maximal score.
Figure 2. Points randomly collected in China through stratified random sampling using the land cover aggregated from MODIS land cover dataset.
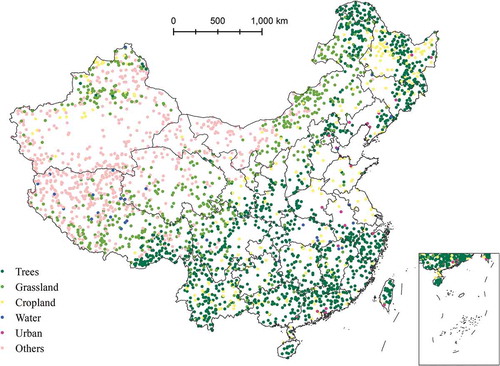
Figure 3. Interpreting land cover types at samples collected in a given area (Feng et al., Citation2012).
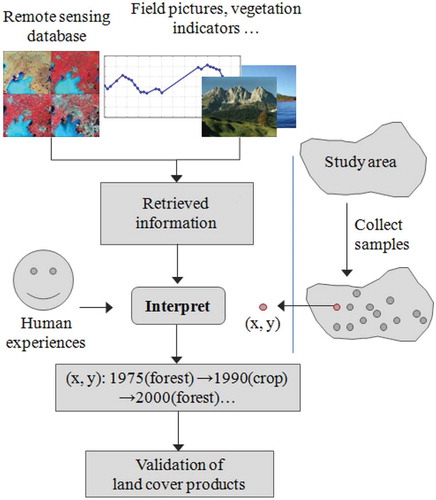
Figure 4. The SYNLCover data sets: (a) SYNLCover-Life Form and (b) SYNLCover-target classification scheme.
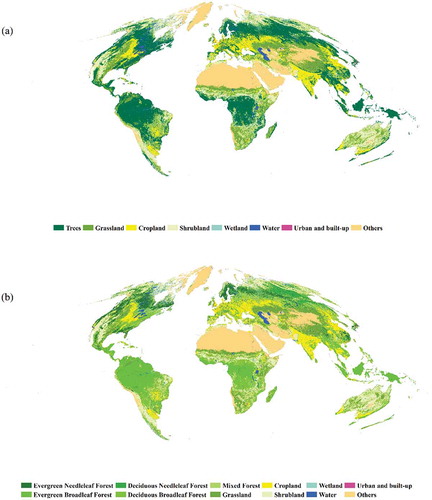
Figure 5. Overall consistencies between SYNLCover, GLCC, UMd, GLC2000, MODIS LC and GlobCover based on (a) life forms and (b) target classification schemes. Map-specific consistency of each map is given along the diagonal.
Figure 6. Comparison of (a) user’s and (b) producer’s accuracy of SYNLCover and the five input maps with life forms in China.
Figure 7. Comparison of (a) user’s and (b) producer’s accuracy of life forms in SYNLCover and its corresponding average accuracy of five input maps over China.
Data availability statement
The data that support the findings of this study area available from the corresponding author upon request.