
Figures & data
Figure 1. Topographic map of the Middle East (gray shaded). Western and southwestern Iran provinces are shown in yellow. The white text denotes mountains.
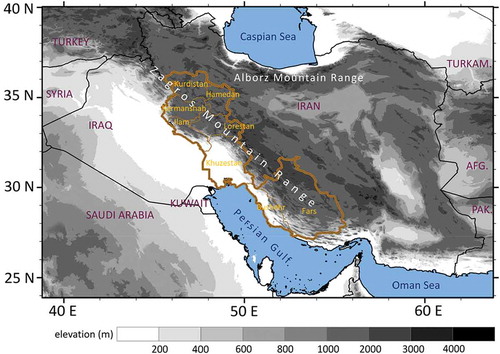
Figure 2. Map of western and southwestern Iran, with the shaded land cover product of MODIS (MCD12Q1). The stations used for dust observations in this study are shown, with the size of circles indicating the percentage frequency of dust days (DDF) from 1979 to 2015. The monthly mean DDF for each station are also shown, and the most active months are marked in a darker color.
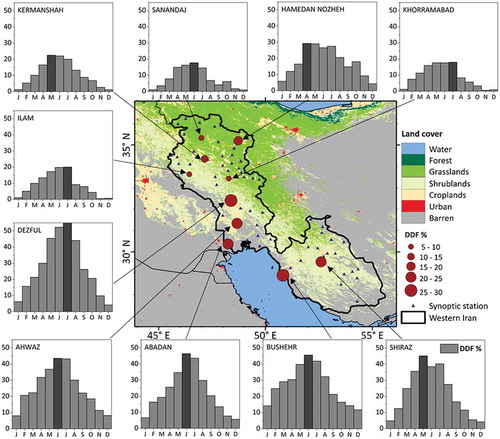
Table 1. Phenomena related to dust according to the World Meteorological Organization (WMO) weather codes.
Table 2. List of the 10 western Iran stations used in this study.
Table 3. A summary of datasets used in this study.
Figure 3. (a) Monthly mean DDF, precipitation, average wind speed and maximum wind speed during 1979–2015 and (b) wind speed frequency (WSF) in the months of March to August in western Iran.
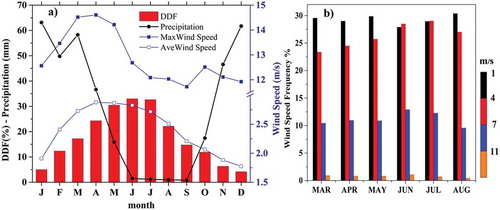
Figure 4. Mean monthly precipitation in (a) winter, (b) spring, (c) summer and (d) autumn in western Iran.
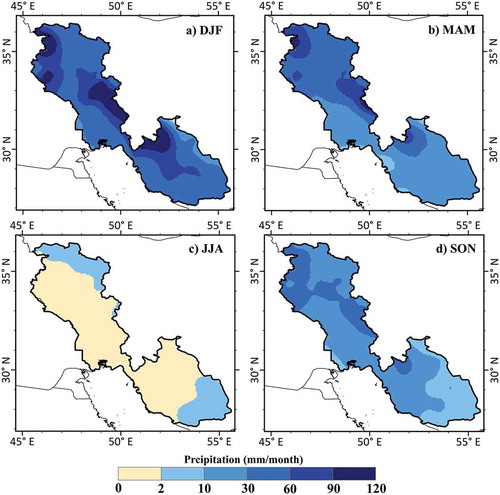
Figure 5. Time series of the dust day frequency (DDF) in spring (blue) and summer (red) during 1979–2015, and their time series after the removal of the linear trend (detrend). Horizontal lines represent the mean DDF in spring and summer.
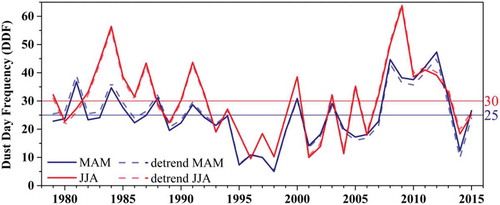
Figure 6. Anomalies (standardized by mean and standard deviation) of the regional mean DDF, precipitation and frequency of strong winds (wind speed more than 11 m/s) in (a) spring and (b) summer during 1979–2015. The correlation coefficients (R) between the DDF and precipitation/wind are also shown with the asterisk denoting a statistical significance at the 0.1 level.
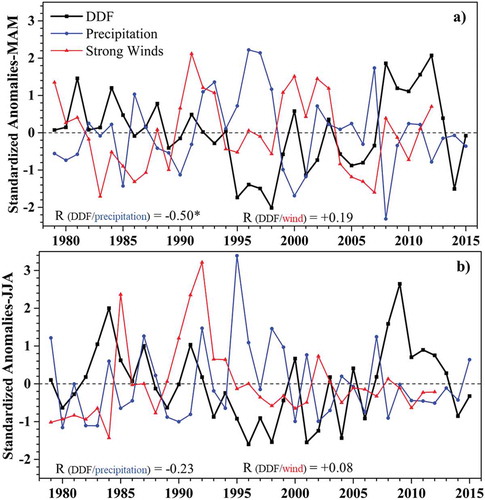
Figure 7. Temporal correlation coefficient between DDF and precipitation and wind speed in spring (a) and summer (b) at the stations. The asterisks denote that the correlation is statistically significant at the 0.1 level. Note that if the correlation coefficient between the DDF and frequency of winds at any intervals (e.g., 1–4 m/s) is larger than that between the DDF and mean wind speed (AveWind), this larger correlation coefficient will be presented.
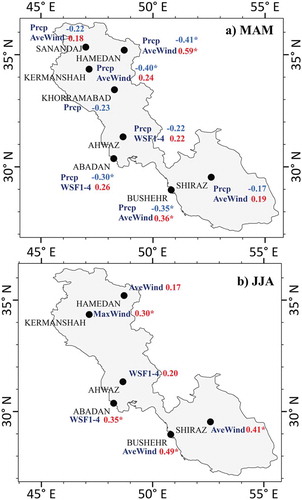
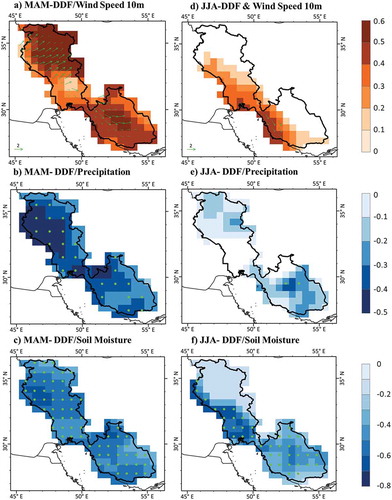
Figure 8. Temporal correlation coefficient (TCC) between regional mean the DDF in western Iran and concurrent wind speed at 10 m (a, d), precipitation (b, e), and soil moisture (c, f) at each grid box in spring (left column) and summer (right column) during 1979–2015. Wind speed data is from ERA-Interim reanalysis. Precipitation is from GPCC V7 reanalysis, and soil moisture is from ERA-Interim/Land reanalysis. Soil moisture is available only for 1979–2010, and thus, the TCC between the DDF and soil moisture is calculated for 1979–2010. Note only positive correlation coefficients for wind speed and negative correlation coefficients for precipitation and soil moisture are shown. The green vectors denote the regression of surface wind upon DDF. Note only areas with positive regression coefficients of wind speed upon DDF that are statistically significant at the 0.1 level are displayed. Dots in Figure 8(b,c,e,f) denote the statistical significance at 0.1 confidence level (i.e., correlation coefficients >0.275).
Data availability statement
Meteorological data are available on the Islamic Republic of Iran Meteorological Organization (IRIMO) website: https://data.irimo.ir. Reanalysis wind speed data from ERA-Interim and soil moisture data from ERA-Interim/Land data are available at the following website: https://apps.ecmwf.int/datasets. Precipitation dataset from GPCC V7 are available at the following website: https://www.esrl.noaa.gov/psd/data/gridded/data.gpcc.html.