
Figures & data
Figure 1. Map of the nine sub-regions of DPEA.
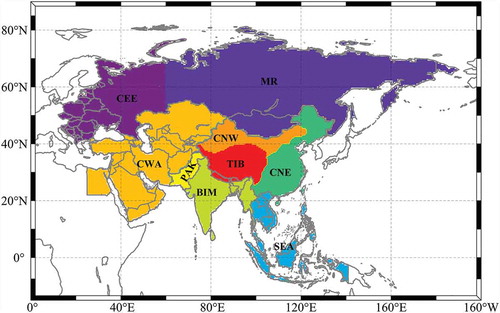
Table 1. Classification of dry conditions for scPDSI and SPI/SPEI.
Figure 2. Spatial distribution of the cross-correlations between scPDSI, SPEI and SPI at different time scales: correlation between (a1–a4) scPDSI and SPEI, (b1–b4) scPDSI and SPI, and (c1–c4) SPEI and SPI. The shaded areas in DPEA represent the grid cells having correlations statistically significant at the 5% level (effective degrees of freedom considered).
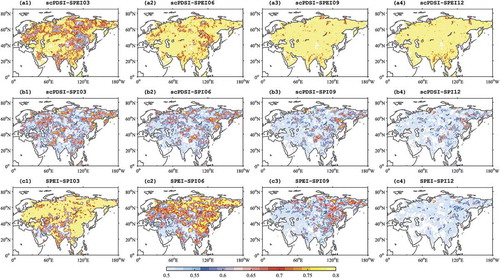
Figure 3. Spatial patterns of the first EOF of the annual (a) SPI12, (b) SPEI12 and (c) scPDSI, and (d) their associated standardized temporal patterns from 1950 to 2015. The variance explained by the EOF is shown in brackets.
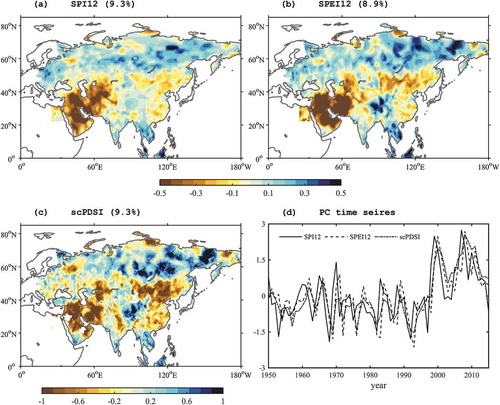
Figure 4. As in , but for (a) GPCC precipitation, (b) CRU precipitation, (c) CRU PET, and (d) their associated standardized temporal patterns.
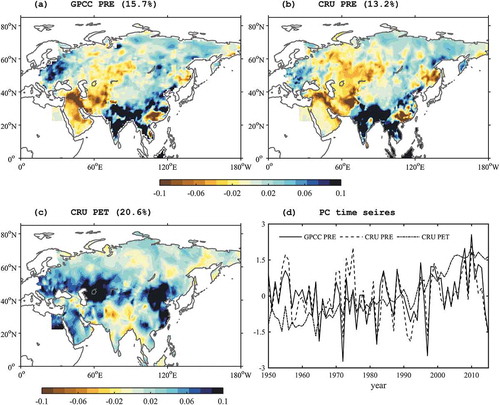
Figure 5. Maps showing the trends of change in annual (a) SPI12, (b) SPEI12 and (c) scPDSI (units: SPI/SPEI/scPDSI values per five decades) from 1950 to 2015. Dotted areas have trends that are statistically significant at the 5% level.
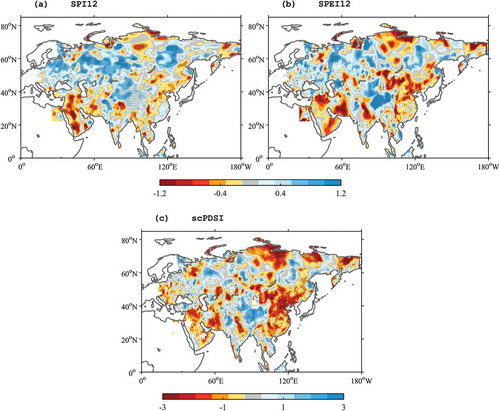
Figure 6. As in , but for (a) GPCC precipitation, (b) CRU precipitation, and (c) CRU PET (units: mm/day per five decades). Dotted areas have trends that are statistically significant at the 5% level.
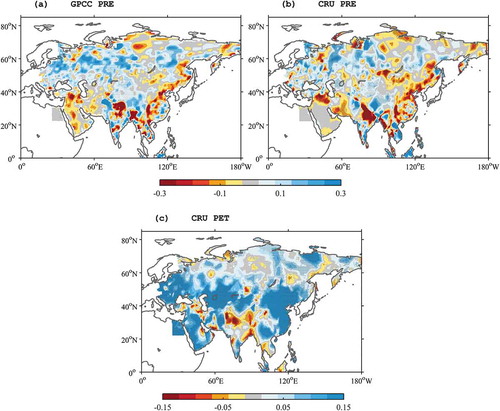
Table 2. Percentage area trends (units: % per five decades) of MD (moderately dry), SD (severely dry) and ED (extremely dry) events in nine sub-regions, based on SPI12, SPEI12 and scPDSI. Bold numbers are statistically significant at least at the 10% level (*10% level; **5% level; ***1% level) A dash (–) indicates no trend.
Figure 7. Annual area percentages for MD (moderately dry; yellow), SD (severely dry; pink) and ED (extremely dry; red) events in the nine sub-regions of DPEA based on SPI12 (a), SPEI12 (b), and scPDSI (c).
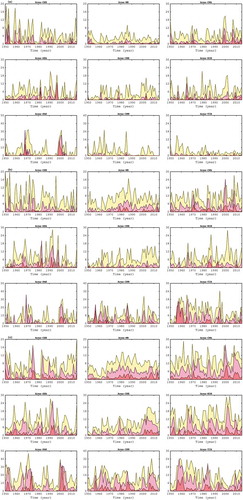
Figure 8. The number of MD [moderately dry (a, d, g)], SD [severely dry (b, e, h)] and ED [extremely dry (c, f, i)] events for DPEA during 1950–2015, based on SPI12 (a–c), SPEI12 (d–f), and scPDSI (g–i). Blanked areas have no drought events identified.
![Figure 8. The number of MD [moderately dry (a, d, g)], SD [severely dry (b, e, h)] and ED [extremely dry (c, f, i)] events for DPEA during 1950–2015, based on SPI12 (a–c), SPEI12 (d–f), and scPDSI (g–i). Blanked areas have no drought events identified.](/cms/asset/92dead16-87cc-40c1-a895-c72eb9171400/tbed_a_1710383_f0008_c.jpg)
Figure 9. As in , but for the mean duration of drought events. Blanked areas have no drought events identified.
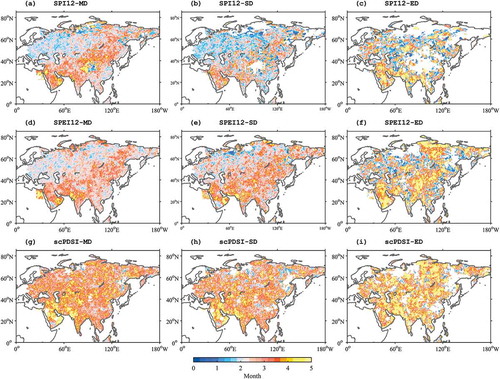
Figure 10. Boxplots for the duration (in months) of MD [moderately dry (a, d)], SD [severely dry (b, e)] and ED [extremely dry (c, f)] events during 1950–2015 over the nine sub-regions of DPEA from SPI (a–c), SPEI (d–f), and scPDSI (g–i). Outlier values are not shown.
![Figure 10. Boxplots for the duration (in months) of MD [moderately dry (a, d)], SD [severely dry (b, e)] and ED [extremely dry (c, f)] events during 1950–2015 over the nine sub-regions of DPEA from SPI (a–c), SPEI (d–f), and scPDSI (g–i). Outlier values are not shown.](/cms/asset/a48bc025-fdda-4b01-bde3-8bd3af6d2737/tbed_a_1710383_f0010_c.jpg)
Figure 11. As in , but for the intensity of drought events. Values have been multiplied by −1.
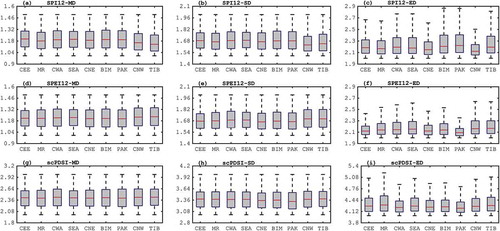
Figure 12. As in , but for the severity of drought events. Values have been multiplied by −1. Yellow-shaded/green-shaded boxes indicate the severity distribution for the period 1951–1980/1981–2015.
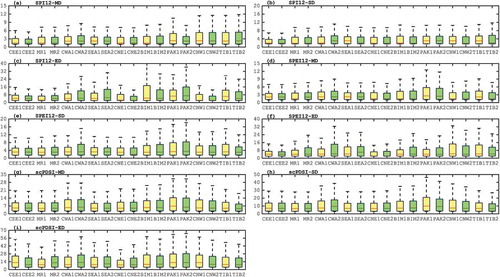
Figure 13. Spatial distribution of the gridded population density (a), drought hazard (b, d, f), and population exposure to drought hazard (c, e, g) of DPEA during 2000–2015 based on SPI12 (b, c), SPEI12 (d, e), and scPDSI (f, g).
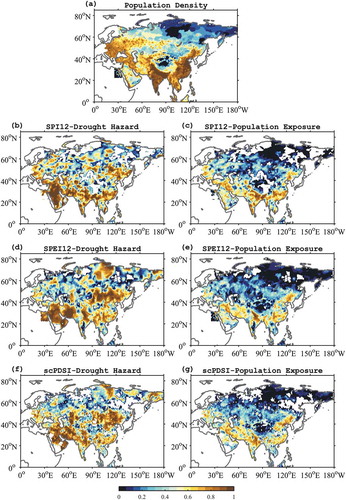
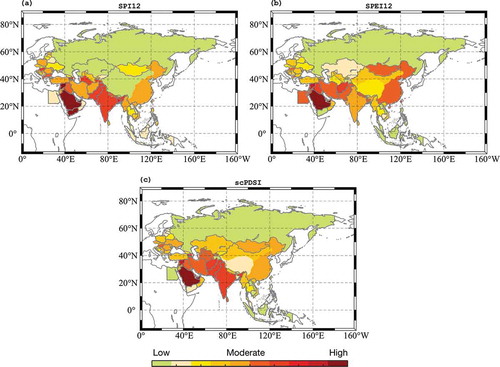
Figure 14. Country-based drought hazard in DPEA during 2000–2015, based on SPI12 (a), SPEI12 (b) and scPDSI (c).
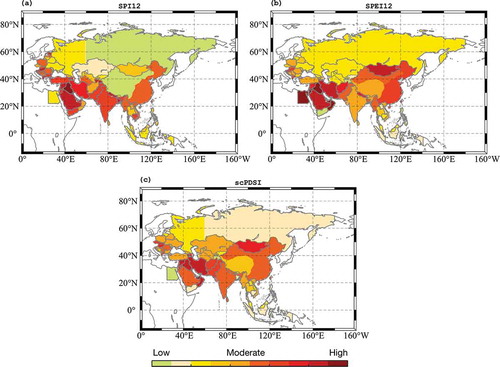
Figure 15. Country-based exposure indicators in DPEA during 2000–2015, presented by population density (a, PDI-Country), agricultural land (b, AL-Country), level of water stress (c, LWS-Country), livestock production index (d, LPI-Country), and composite exposure (e, DEI-Country).
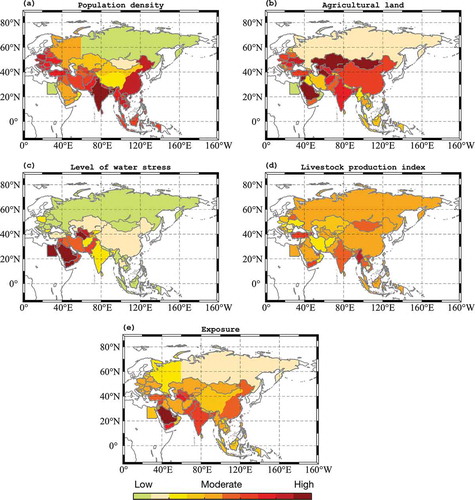
Figure 16. Country-based vulnerability indicators in DPEA during 2000–2015, presented by GDP per capita (a, GDP-Country), poverty headcount ratio (b, PHR-Country), rural population (c, RP-Country), population ages 65 and above (d, PA65-Country), agricultural irrigated land (e, AIL-Country), renewable internal freshwater (f, RIFW-Country), and composite vulnerability (g, DVI-Country).
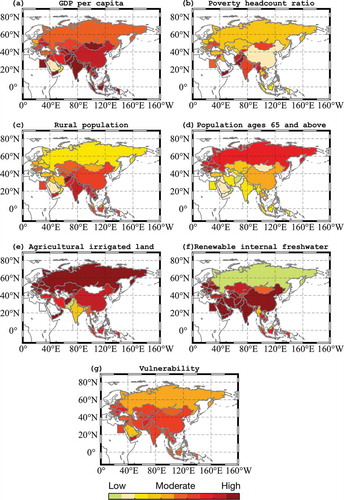
Figure 17. Country-based drought risk in DPEA during 2000–2015, based on SPI12 (a), SPEI12 (b), and scPDSI (c).
Data availability statement
The datasets of drought events and risks that support the findings of this study are openly available in the Matlab format and in Science Data Bank at http://www.dx.doi.10.11922/sciencedb.898.