
Figures & data
Figure 1. Flow diagram for the production of the dataset of high temperature extremes over major BR land areas for the period of 1979–2018.
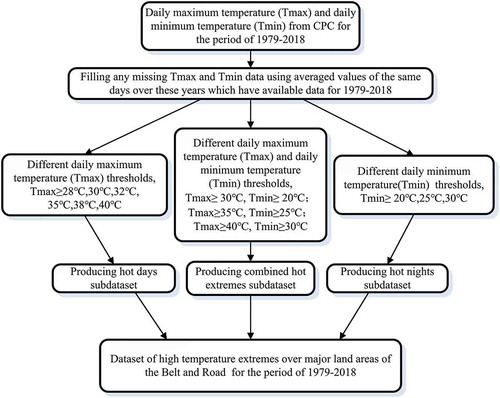
Figure 2. The mean hot days with Tmax thresholds of 28 °C, 30 °C, 32 °C (the first row), 35 °C, 38 °C, 40 °C (the second row), mean hot nights with Tmin thresholds of 20 °C, 25 °C, 30 °C (the third row) and mean combined hot extremes with a Tmax threshold of 30 °C and a Tmin threshold of 20 °C, a Tmax threshold of 35 °C and a Tmin threshold of 25 °C, and a Tmax threshold of 40 °C and a Tmin threshold of 30 °C (the forth row) for the period of 1979–2018 over the major BR land areas.
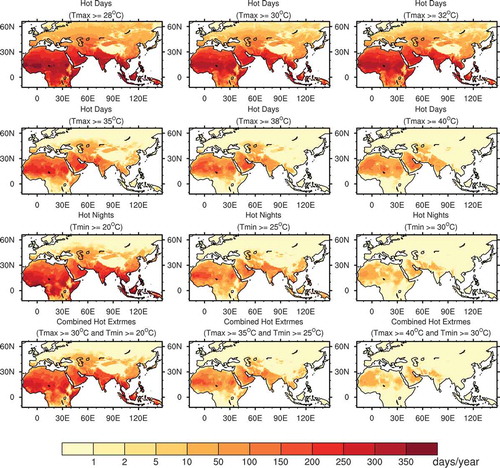
Figure 3. Distributions of mean hot days, hot nights and combined hot extremes (the first and third rows) and their times series averaged over major the BR land areas (the second and fourth rows) for the period of 1979–2018 with thresholds of the 90th and 95th percentiles of Tmax and Tmin.
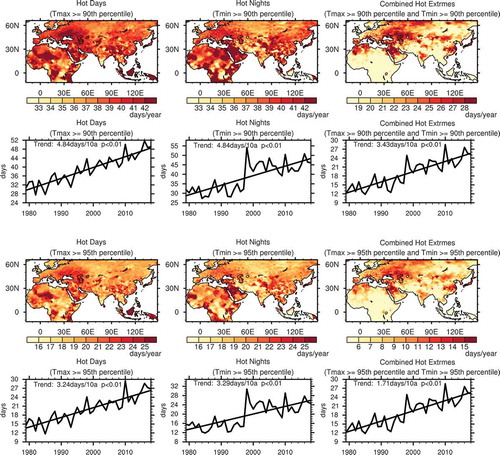
Figure 4. Spatial patterns and time coefficients of the first EOF mode of hot days (Tmax ≥ 40°C, left panel), hot nights (Tmin ≥ 30°C, middle panel) and combined hot extremes (Tmax ≥ 40°Cand Tmin ≥ 30°C, right panel) over Southwest Asia (15°N-38°N, 40°E-61°E) for the period of 1979–2018. The percentages of total variances explained by the first EOF modes are also shown.
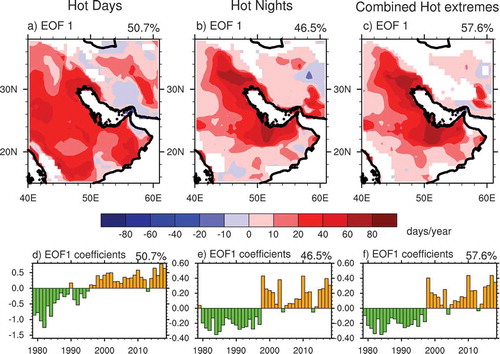
Figure 5. Spatial patterns and time coefficients of the second EOF mode of hot days (Tmax ≥ 40°C, left panel), hot nights (Tmin ≥ 30°C, middle panel) and combined hot extremes (Tmax ≥ 40°Cand Tmin ≥ 30°C, right panel) over Southwest Asia (15°N-38°N, 40°E-61°E) for the period of 1979–2018. The percentages of total variances explained by the second EOF modes are also shown.
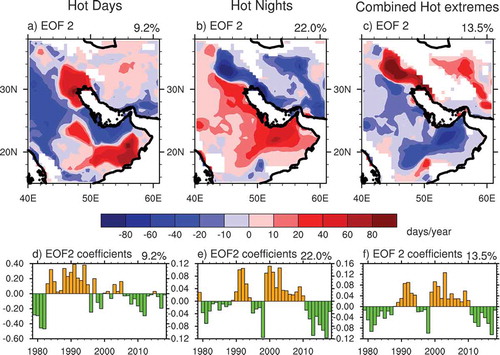
Figure 6. Time series of hot days (Tmax ≥ 40°C), hot nights (Tmin ≥ 30°C) and combined hot extremes (Tmax ≥ 40°C and Tmin ≥ 30°C) averaged over Southwest Asia (15°N-38°N, 40°E-61°E) for the period of 1979–2018 (solid lines). The dotted lines represent the linear trends of hot days, hot nights and combined hot extremes; the confidence levels of the linear trends are also shown.
Figure 7. Hot days (Tmax ≥ 30°C), hot nights (Tmin ≥ 20°C) and combined hot extremes (Tmax ≥ 30°C and Tmin ≥ 20°C) over eastern China averaged over the period of 1979–2011 (The top row: based on the CGDV2 gridded temperature dataset; the middle row: based on the CPC gridded temperature dataset), and differences between extreme high temperature based on the two gridded temperature datasets (The bottom row: the middle row minus the top row).
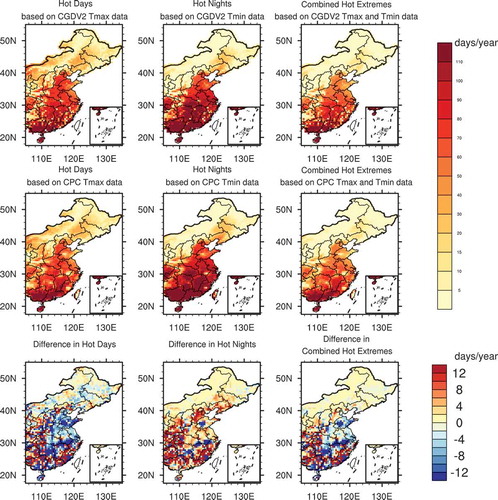
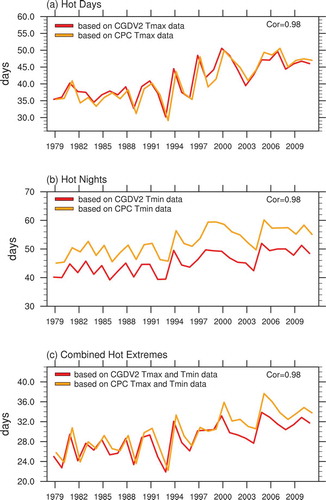
Figure 8. Hot days (Tmax ≥ 30°C), hot nights (Tmin ≥ 20°C) and combined hot extremes (Tmax ≥ 30°C and Tmin ≥ 20°C) averaged over the eastern China for the period of 1979–2011 (Red line: based on the CGDV2 gridded temperature dataset; Orange line based on the CPC gridded temperature dataset). The correlation coefficients are also shown.
Data availability statement
The dataset is openly available in Science Data Bank at http://www.sciencedb.cn/dataSet/handle/904 in NetCDF format, with DOI: 10.11922/sciencedb.904.