
Figures & data
Table 1. Values of the parameters in the Ensemble_all model for each ecosystem.
Figure 1. Comparison of Reco data from Reco_2001_2010_data_set, from Jung et al. (Citation2019) and site observations for major ecosystems; unit: gCm−2d−1.
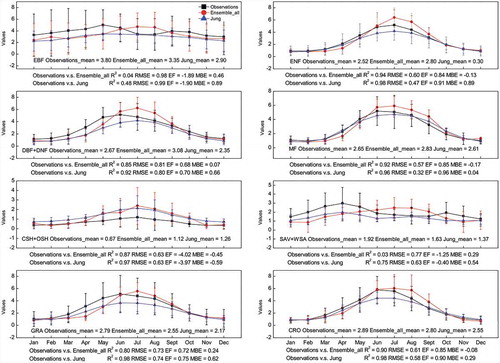
Figure 2. Seasonal Reco patterns from Reco_2001_2010_data_set (unit: gCm−2). Spring: March, April and May; Summer: June, July and August; Autumn: September, October and November; Winter: December, January and February. The largest seasonal change occurs in the northern hemisphere.
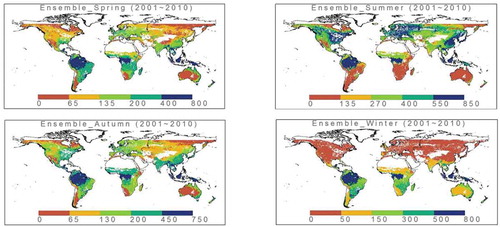
Figure 3. Annual ecosystem respiration patterns from Reco_2001_2010_data_set, from process model LPJ_S1 and from Jung et al. (Citation2019) (unit: gCm−2a−1); differences in annual ecosystem respiration patterns between Reco_2001_2010_data_set and Yuan et al. (Yuan et al., Citation2011) (Unit: gCm−2a−1); differences in annual ecosystem respiration patterns between Reco_2001_2010_data_set and LPJ_S1 (Unit: gCm−2a−1); differences in annual ecosystem respiration patterns between Reco_2001_2010_data_set and Jung et al. (Jung et al., Citation2019) (Unit: gCm−2a−1).
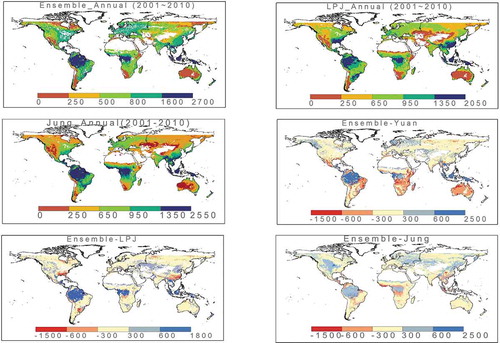
Table 2. The difference between the annual total amount of Reco from Reco_2001_2010_data_set and the flux-measured data at the sites where the difference between the four data sets was the largest (The values in Reco_2001_2010_data_set were closer to the observations than those in the other three data sets (LPJ_S1, Yuan et al. (Citation2011)) and Jung et al. (Citation2019)) were.
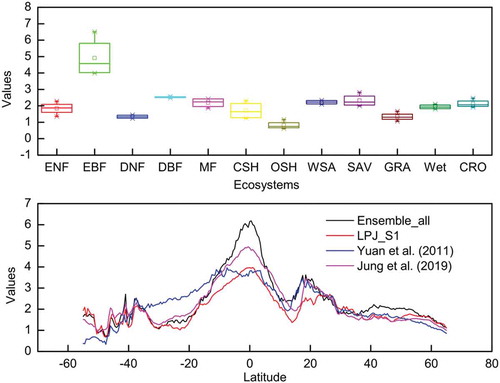
Figure 4. Comparison between Reco values for different ecosystems according to the four different data sets (upper); comparisons between the latitudinal distribution of Reco according to the four sources (lower) (negative sign means the North Hemisphere, positive sign means the South Hemisphere).
Data availability statement
The data set is openly available from the Science Data Bank at http://www.dx.doi.org/10.11922/sciencedb.934.