
Figures & data
Table 1. Classification standard of extreme events hazards.
Figure 1. Sequence of the mean annual temperature anomalies for the (a) global and (b) China regional scales from 1850 to 2100 relative to 1861–1890.
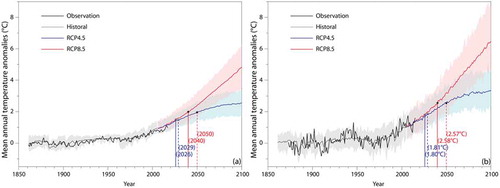
Figure 2. Spatial patterns of the warming ranges in China for 1.5°C and 2°C of global warming.
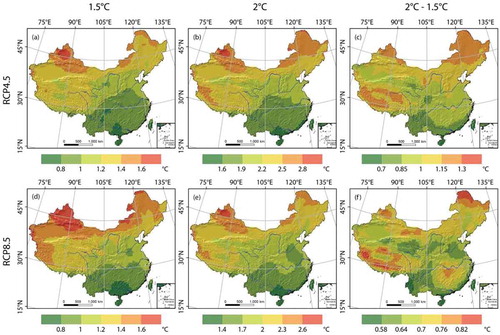
Figure 3. Spatial patterns of the percentage of the mean annual precipitation anomalies in China for 1.5°C and 2°C of global warming.
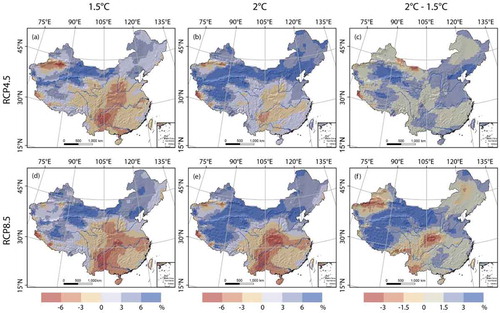
Table 2. The distribution area (units: million km2) and average hazard indexes of heatwaves for 1.5°C and 2°C of global warming.
Figure 4. Spatial patterns of the heatwave hazard indexes in China for 1.5°C and 2°C of global warming under the RCP8.5 scenario.
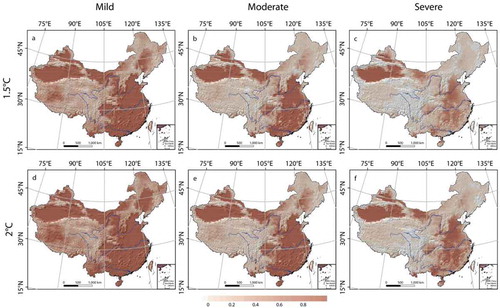
Table 3. The distribution area (units: million km2) and average hazard indexes of floods for 1.5°C and 2°C of global warming.
Figure 5. Spatial patterns of flood hazard indexes in China for 1.5°C and 2°C of global warming under the RCP8.5 scenario.
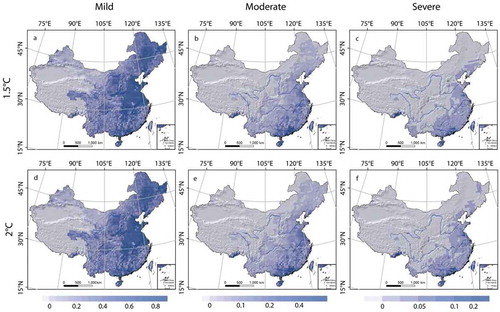
Table 4. The distribution area (units: million km2) and average hazard indexes of droughts for 1.5°C and 2°C of global warming.
Figure 6. Spatial patterns of drought hazard indexes in China for 1.5°C and 2°C of global warming under the RCP8.5 scenario.
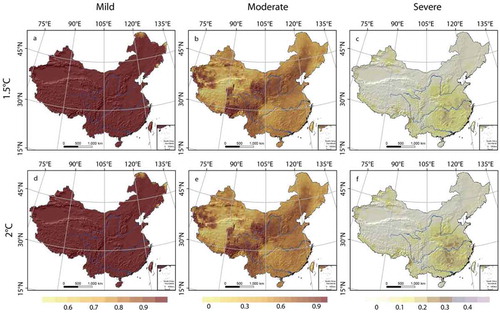
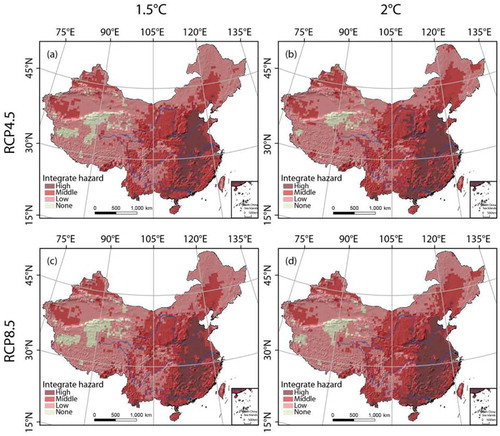
Table 5. The distribution area of integrated hazards for 1.5°C and 2°C of global warming (units: million km2).
Figure 7. Spatial patterns of integrated hazards in China for 1.5°C and 2°C of global warming.
Supplemental Material
Download MS Word (23.3 MB)Data availability statement
CMIP5 and ISIMIP climate scenario data are available at the Earth System Grid Federation data node at the Lawrence Livermore National Laboratory: https://esgf-node.llnl.gov/search/esgf-llnl/. The series of global mean annual temperatures can be visualized on the following web-portal: http://www.cru.uea.ac.uk/data. The series of mean annual temperatures in China are available for download from the reference: Tang, G. L., Ding, Y. H., Wang, S. W., Ren, G. Y., Liu, H. B., & Zhang, L. (2009). Comparative analysis of the time series of surface air temperature over China for the last 100 years, Advances in Climate Change Research, 5, 71-78.