
Figures & data
Table 1. The yearly models of bias correction at five channels. The bias between MWRI and AMSR2 TB data before and after bias correction from January 2018 to June 2020.
Figure 1. The result of daily (solid curves) and monthly (solid rectangles) dynamic sea ice tie points P1 (orange) and open water tie points P0 (blue) from January 2018 to June 2020.
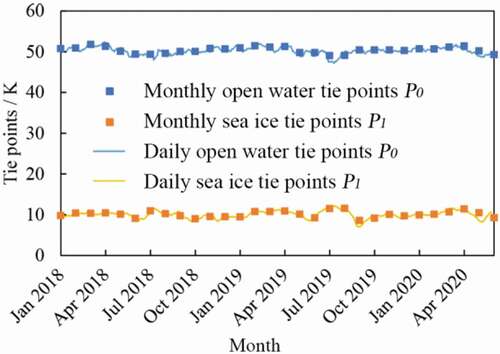
Table 2. The information of the MWRI SIC product provided by this study.
Figure 2. The bias between our MWRI SIC product and AMSR2 SIC product based on the ASI algorithm using fixed tie points from January 2018 to June 2020.
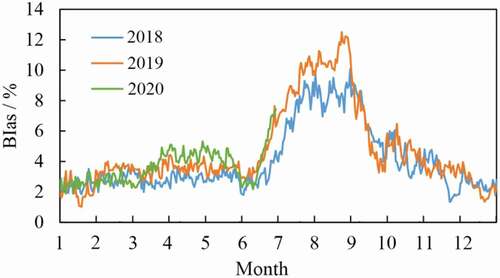
Figure 3. The spatial distribution of MODIS scenes used in this study.
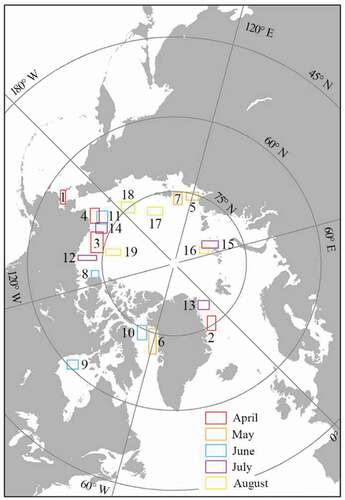
Table 3. The validation results of the MWRI SIC with the MODIS SIC in 2018.
Figure 4. MODIS Band 2 reflectance, the ice-water binary map, the MODIS SIC, and the MWRI SIC of Image 1 (02 April 2018) and Image 6 (12 May 2018).
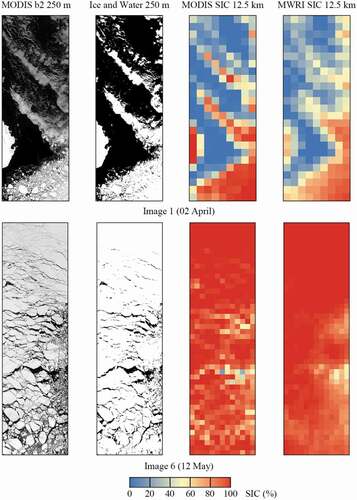
Figure 5. MODIS Band 2 reflectance, the ice-water binary map, the MODIS SIC, and the MWRI SIC of Image 3 (15 April 2018), Image 7 (25 May 2018) and Image 10 (15 June 2018).
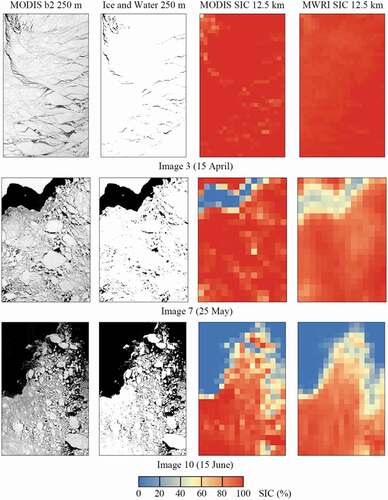
Figure 6. MODIS Band 2 reflectance, the ice-water binary map, the MODIS SIC, and the MWRI SIC of Image 9 (08 June 2018), Image 14 (14 July 2018) and Image 16 (02 August 2018).
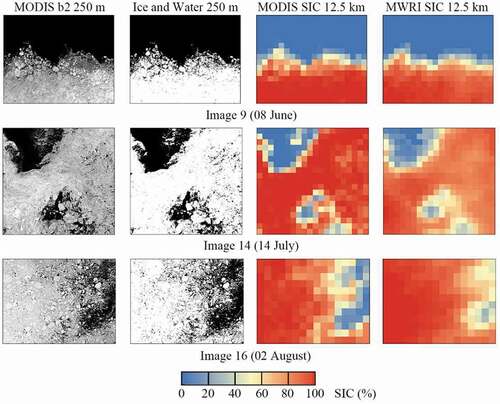
Figure 7. MODIS Band 2 reflectance, the ice-water binary map, the MODIS SIC, and the MWRI SIC of Image 12 (02 July 2018) and Image 19 (24 August 2018).
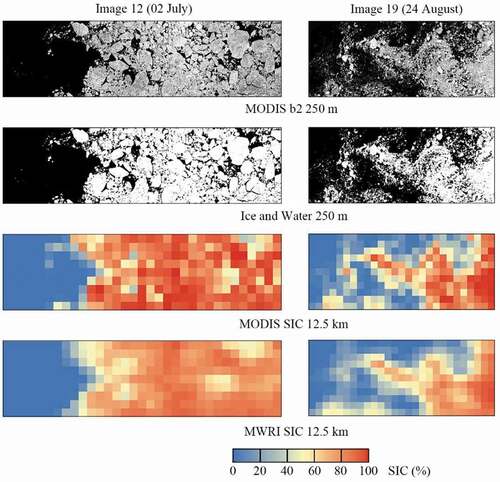
Table 4. The comparison results between two MWRI SICs and the corresponding MODIS SIC in 2018. “A/B”: A is the statistic results of our MWRI SIC product and B is the statistic results of the published MWRI SIC product based on the NT2 algorithm.
Data Availability Statement
The dataset is openly available in the Science Data Bank at http://www.dx.doi.org/10.11922/sciencedb.00137.