
Figures & data
Figure 1. Process example of resource allocation for X nodes: (a) the bi-partite graph, (b) the X and Y projections, and (c) the number of common neighbours in Y and X – Source Zhou et al. (Citation2007)
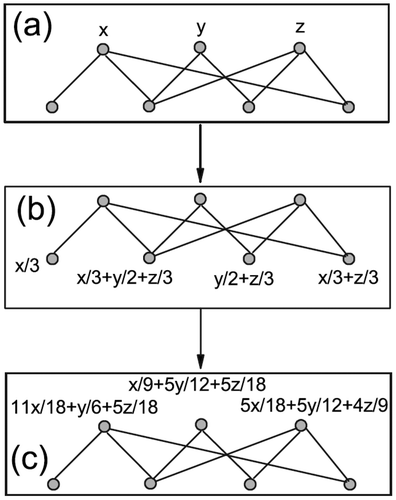
Figure 2. Room with IoT infrastructure and possible service components – Source Cisco Systems (Citation2009)
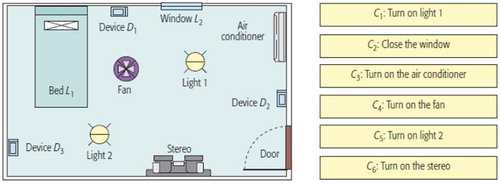
Figure 3. Possible data flows between different service components
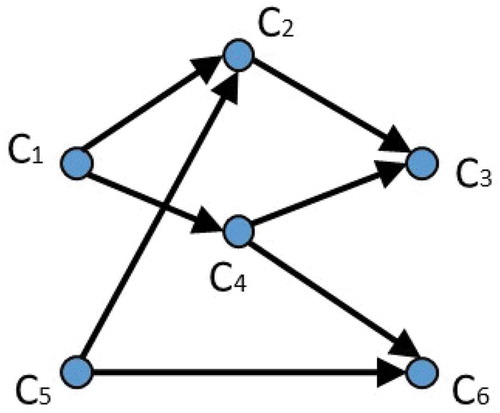
Figure 4. Bi-partite graph representing IoT devices and service components of a smart home environment
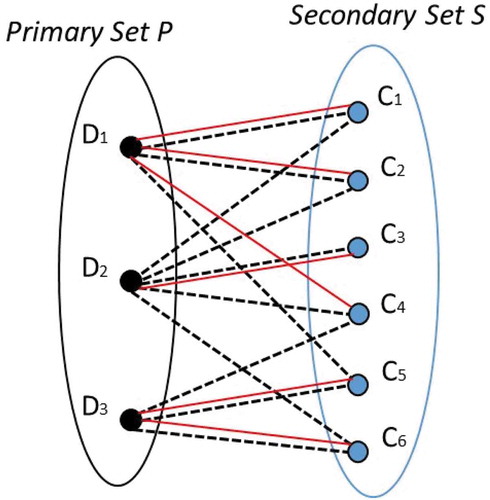
Figure 5. Two-tier infrastructure represented as a bi-partite graph
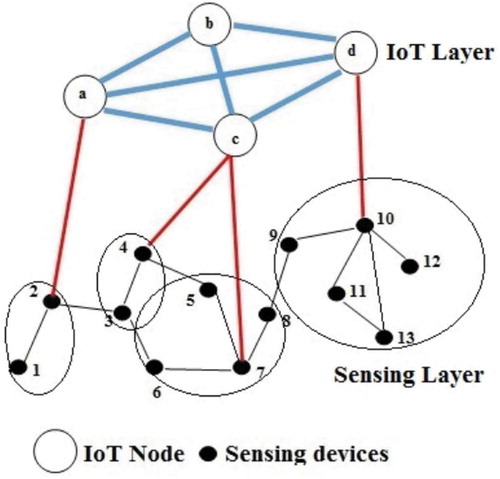
Figure 6. Comparison of community detection algorithms – Source Papadopoulos et al. (Citation2011)
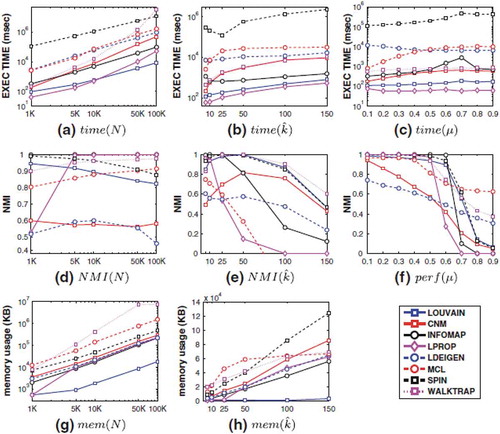
Table 1. Steps to allocate dmin according to the current velocities of IoMT devices
Figure 7. An example of a bi-partite graph based on mobility relationships between neighbours
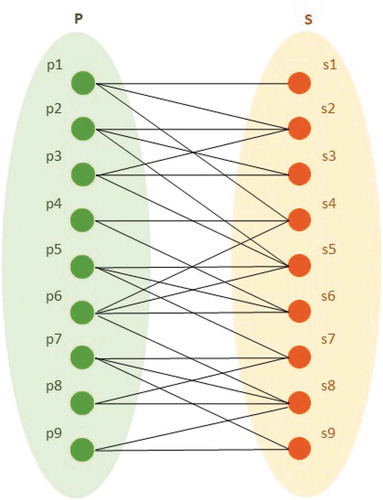
Table 2. Steps to create a bi-partite graph
Table 3. Steps to find communities in IoMT networks
Figure 8. US highway 101 segment used for our real-world scenario
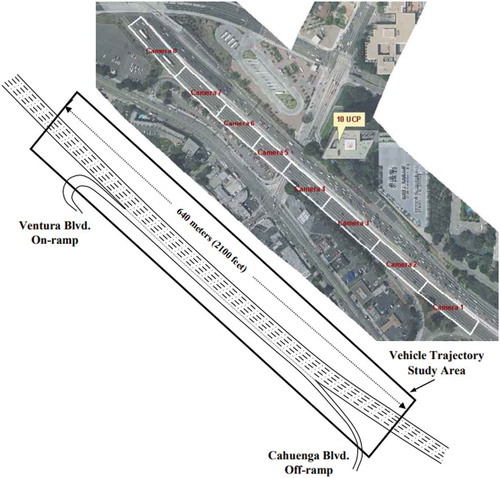
Table 4. Example of IoMT data collected by a smart car
Figure 9. Example of a bi-partite graph of smart vehicles and their neighbours moving on highway
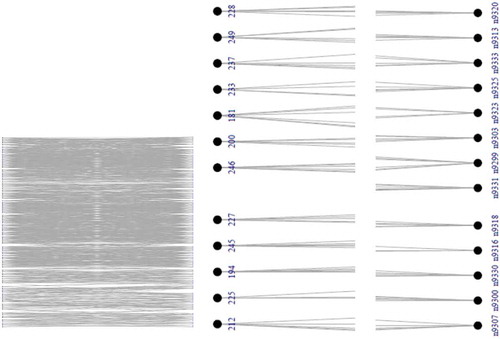
Table 5. Overview of the community detection results
Figure 10. Sequential snapshots of the evolving communities with dmin = 25 m
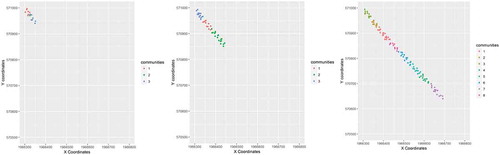
Figure 11. Number of connected vehicles discovered in each community (i.e. cluster)
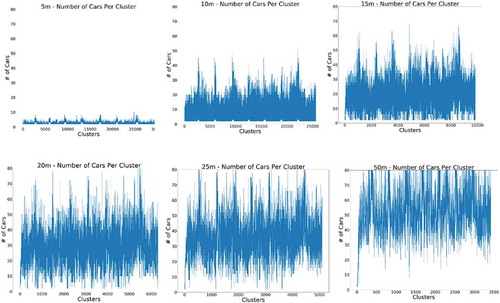
Figure 12. Number of smart cars discovered in each community for modifiable dmin.
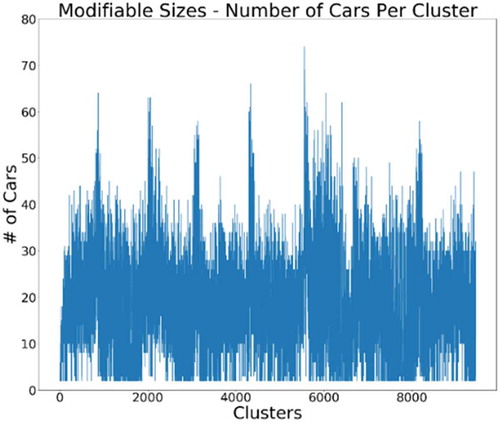
Figure 13. Number of communities on the highway over time
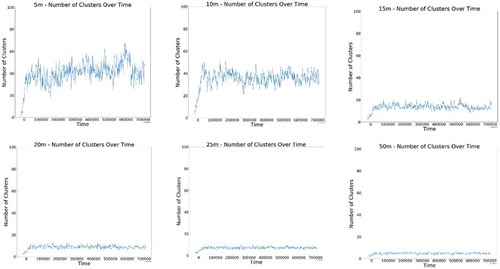
Figure 14. Number of communities on the highway for modifiable mobility neighbourhoods
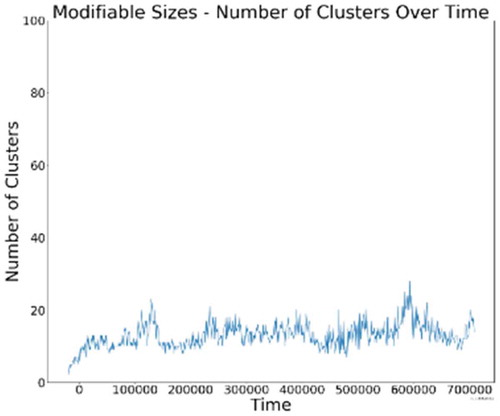
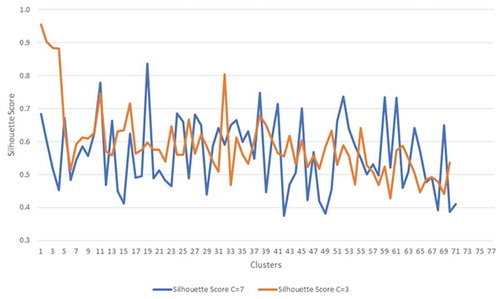
Figure 15. Sample of the generated silhouette index values
Data availability statement
The data that support the findings of this study are openly available in Next Generation Simulation (NGSIM) Vehicle Trajectories and Supporting Data (opendatanetwork.com) at https://www.opendatanetwork.com/dataset/data.transportation.gov/.