
Figures & data
Figure 1. Statistical data for different disaster types in the Belt and Road region from 2015 to 2019.
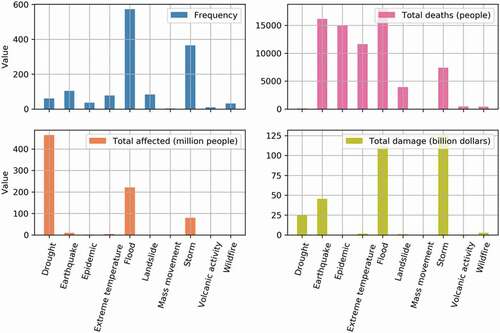
Figure 2. The frequency of disasters in the countries of the Belt and Road region from 2015 to 2019.
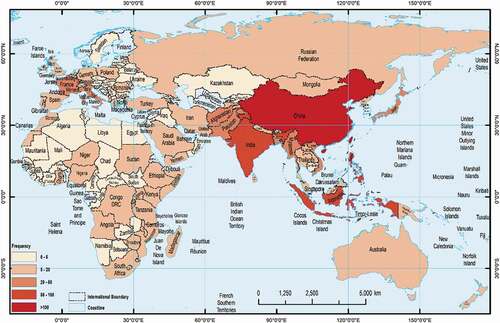
Figure 3. The total number of affected people in countries of the Belt and Road region from 2015 to 2019.
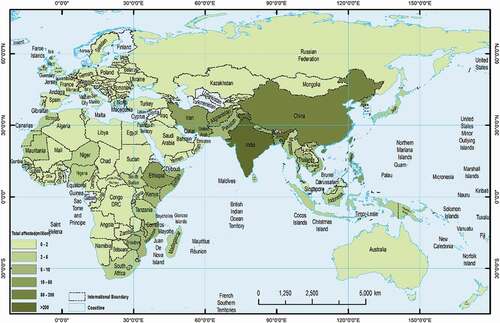
Figure 4. Sum of for the countries in the Belt and Road region from 2015 to 2019.
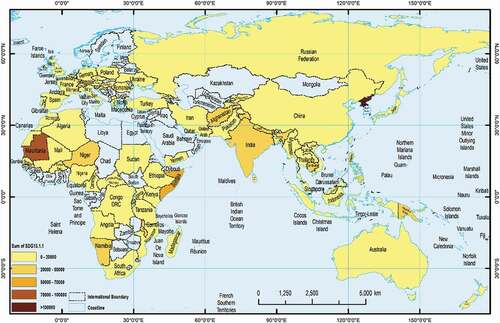
Figure 5. Histograms of the slope of for the countries in the Belt and Road region from 2015 to 2019.
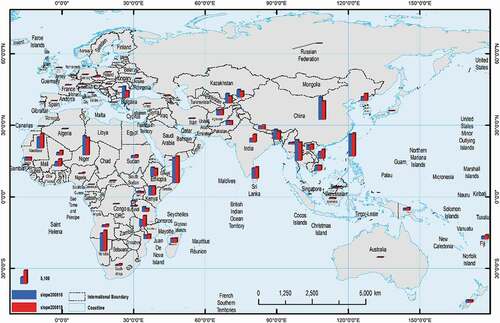
Figure 6. for the countries in the Belt and Road region from 2015 to 2019.
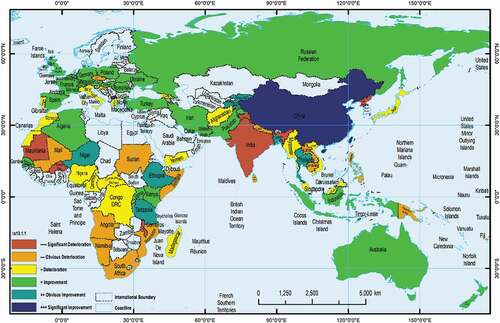
Figure 7. Original slope values for countries in the Belt and Road region from 2015 to 2019.
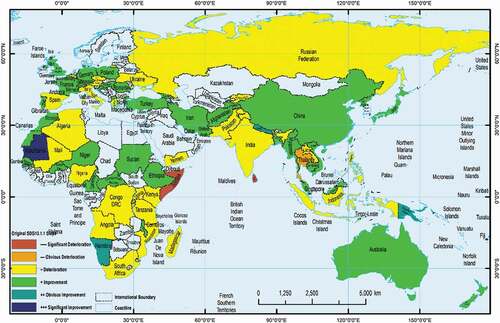
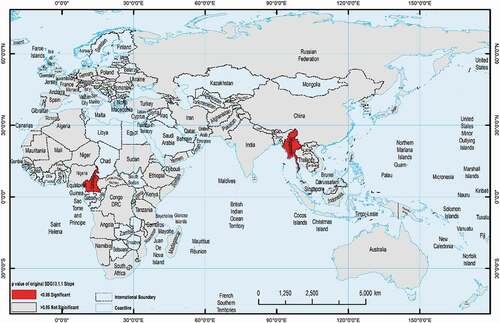
Figure 8. P values for the trend in for countries in the Belt and Road region from 2015 to 2019.
Data availability statement
The data that support the findings of this study are openly available in ScienceDB at http://www.dx.doi.org/10.11922/sciencedb.j00076.00055.