
Figures & data
Figure 1. Distribution of 24 sampling points in Shunyi District, Beijing.
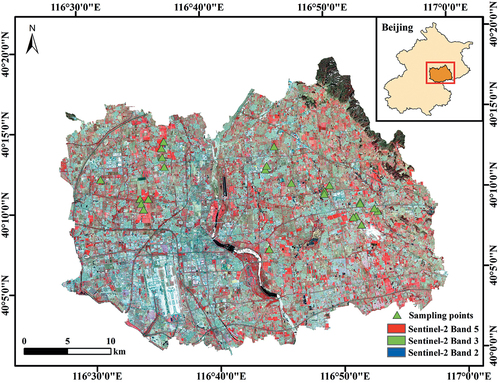
Table 1. Statistical analysis of LCD, LAI and CCD at different growth stages.
Table 2. Central wavelength and bandwidth of Sentinel-2 spectral bands.
Table 3. The list of vegetation indices used in this study.
Figure 2. Correlation results between LAI, CCD and VI calculated from Sentinel-2 data.
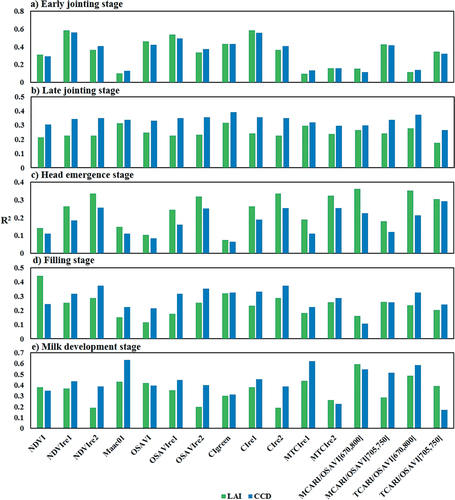
Table 4. RMSE and p-value between vegetation indicese and parameters with Sentinel-2 data
Figure 3. Correlation results between LAI, CCD and VI calculated from hyperspectral data.
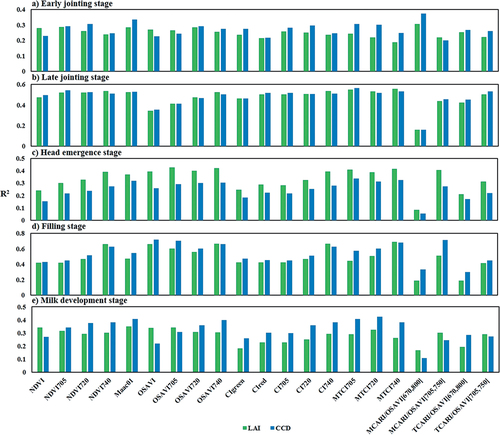
Table 5. RMSE and p-value between vegetation indices and parameters with hyperspectral data.
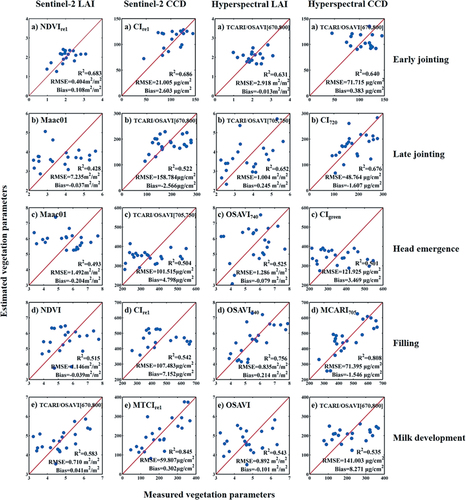
Figure 4. Scatterplots of estimated vegetation parameters versus measured vegetation parameters for spectral indices with Sentinel-2 data and hyperspectral data. Red solid lines indicate 1:1 lines. The five rows from up to bottom indicate the validation results at early jointing stage, late jointing stage, head emergence stage, filling stage and milk development stage, separately. The four columns from left to right indicate the vegetation parameters as Sentinel-2 LAI, Sentinel-2 CCD, hyperspectral LAI and hyperspectral CCD.
Data availability statement
For the moment, the data from the project are not available due to restrictions.