
Figures & data
Figure 1. SMEAR II is our flagship station in a boreal coniferous forest with satellite sites in a nearby lake and peatland. It provides comprehensive, on-line long-term measurements on the Earth surface–atmosphere processes and interactions since year 1995. The world’s longest data series on atmospheric aerosol size distribution has been collected at SMEAR II. The comprehensive ground-based data are best utilized when combined with remote data and multiscale models
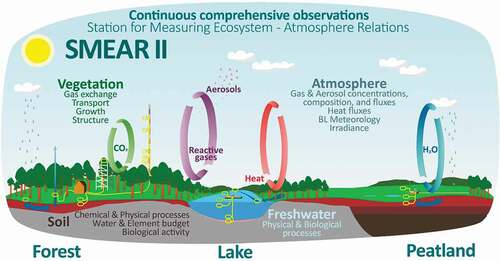
Figure 2. Schematic example of a complex feedback loop studied at SMEAR II (Kulmala et al., Citation2020, Citation2014, Citation2004). Biosphere productivity and further biogenic volatile compounds emitted from vegetation contribute to atmospheric chemistry and aerosol dynamics. Aerosol dynamics feeds back to biosphere productivity and emissions via two loops: 1) by contributing to cloud condensation nuclei (CCN) and further to cloud properties and precipitation, and 2) by increasing the ratio of scattered solar radiation that plants can utilize more efficiently than direct radiation. Finally, the ecosystem-atmosphere entity feeds back to the global climate as increasing air temperature and atmospheric CO2 concentration have a positive effect on boreal vegetation productivity and emissions, whereas vegetation productivity decreases atmospheric CO2 concentration via terrestrial carbon sink increasing cloudiness, which decreases air temperature
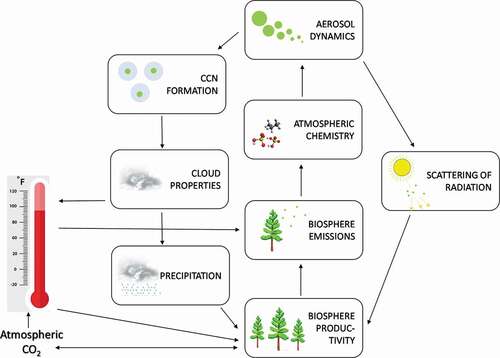
Figure 3. Wind roses from SMEAR II (Hyytiälä station) and SMEAR I (Värriö station) from 2004 to 2020. The length from the centre shows the frequency of the wind directions (%) and colour scale reflects the intensity of the winds associated with the direction. The results are presented as 10 min averages measured above the canopy (33.6 m in Hyytiälä and 16 m in Värriö)
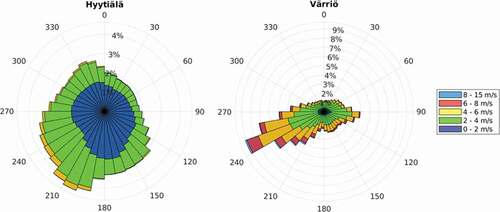
Figure 4. Daytime (12:00–15:00) monthly median near surface soil temperature between 1997 and 2020 (a) in SMEAR II (Hyytiälä) and (c) SMEAR I (Värriö). Average diurnal variation in soil temperature shown as hourly medians of January and July data of the whole measurement period for (b) Hyytiälä and (d) Värriö
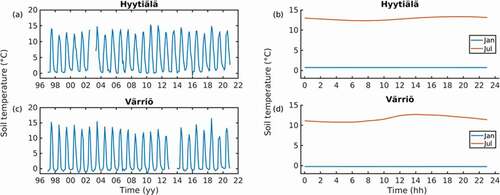
Figure 5. Daytime (12:00–15:00) monthly median ecosystem gross primary production (GPP), i.e. the CO2 uptake rate through photosynthesis (a) in SMEAR II (Hyytiälä) between 1997 and 2020, and (c) in SMEAR I (Värriö) between 2012 and 2020. Average diurnal variation in GPP shown as hourly medians of January and July data of the whole measurement period for (b) Hyytiälä and (d) Värriö
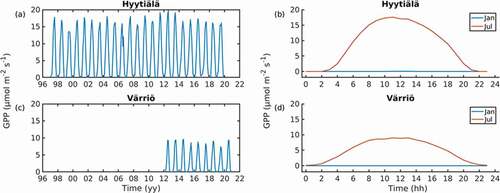
Figure 6. Daytime (12:00–15:00) monthly median O3 concentration between 1998 and 2020 (a) in SMEAR II (Hyytiälä) and (c) in SMEAR I (Värriö). Average diurnal variation in O3 concentration shown as hourly medians of January and July data of the whole measurement period for (b) Hyytiälä and (d) Värriö
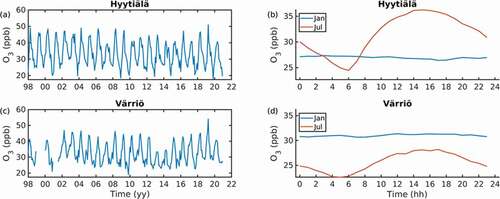
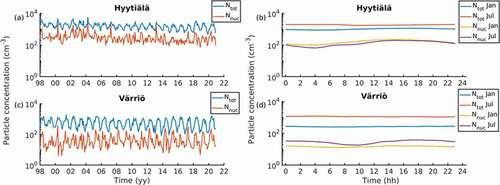
Figure 7. Daytime (12:00–15:00) monthly median total (Ntot) and nucleation mode (Nnuc) particle number concentrations between 1998 and 2020 (a) in SMEAR II (Hyytiälä) and (c) in SMEAR I (Värriö). Average diurnal variation in particle concentrations is shown as hourly medians of January and July data of the whole measurement period (b) for Hyytiälä and (d) for Värriö. The particle number concentrations were calculated using DMPS (differential mobility particle sizer) measurements. The nucleation mode includes particles with diameter between 3 and 25 nm in electrical equivalent diameter. Note that in Värriö the lower cut-off size of the DMPS system was 8 nm until May 2003. The upper cut-off size of Hyytiälä DMPS was extended from 500 nm to 1000 nm in December 2004, and in Värriö the upper cut-off size was extended from 500 nm to 850 nm in October 2004
Data availability statement
The data that support the findings of this study are openly available at https://smear.avaa.csc.fi/or from the corresponding author ([email protected]) upon reasonable request.