
Figures & data
Figure 1. Locations of provinces and regions in China
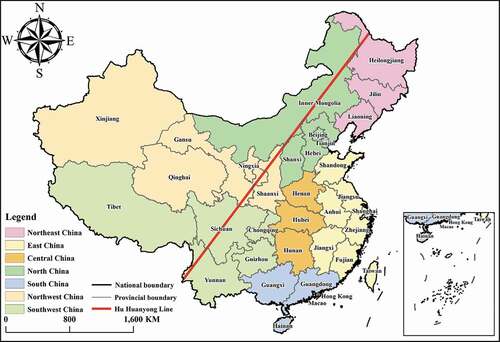
Figure 2. Areas in China covered by urban green space, 2015 (National Geomatics Center of China; http://ngcc.sbsm.gov.cn). Spatial scale 1:4,000,000
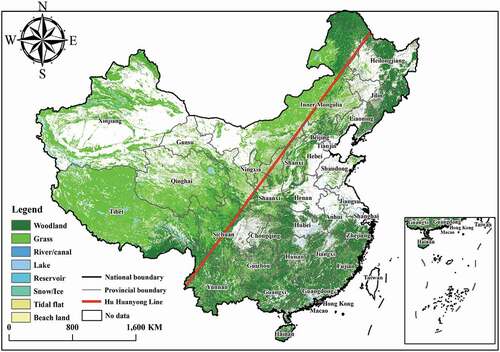
Table 1. Types of land use and cover change
Table 2. Points of interest layers
Table 3. Points of interest related to the actual utilization status of urban green space
Figure 3. Urban green space indicators for assessing actual utilization. (a) utilized intra-urban green space; (b) intra-urban green space not utilized; (c) utilized peri-urban green space; and (d) peri-urban green space not utilized
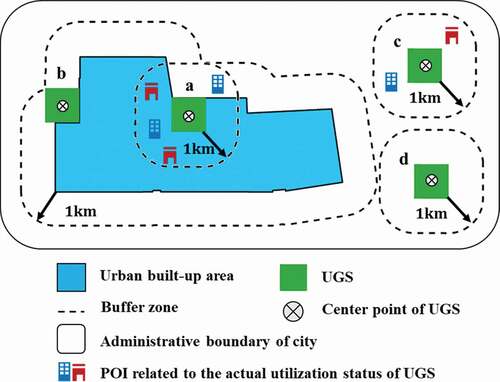
Figure 4. Spatial patterns of urban green space and its actual utilization at the city level in China
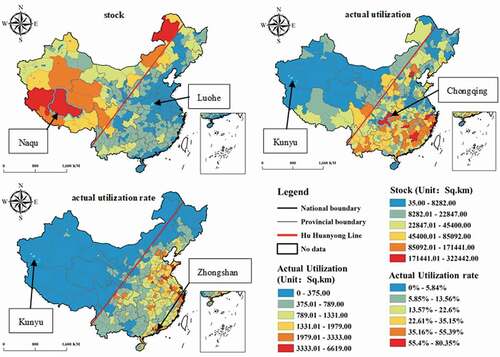
Figure 5. Hot spot analysis of urban green space and its actual utilization at the city level in China
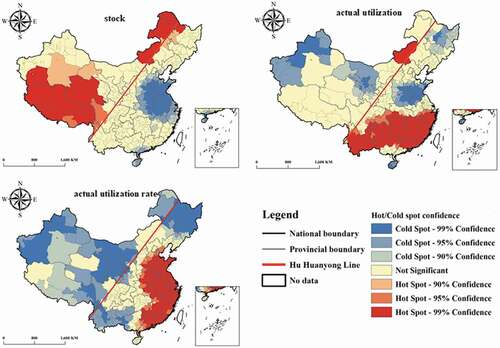
Figure 6. Spatial patterns of intra-urban green space and its actual utilization at the city level in China
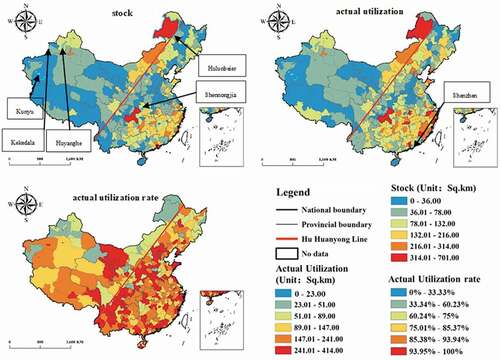
Figure 7. Hot spot analysis of intra-urban green space and its actual utilization at the city level in China
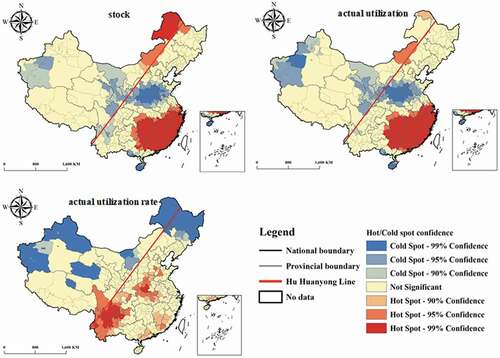
Figure 8. Spatial patterns of peri-urban green space and its actual utilization at the city level in China
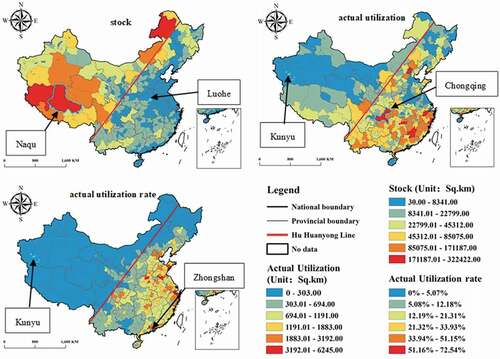
Figure 9. Hot spot analysis of peri-urban green space and its actual utilization at the city level in China

Figure 10. The differences in actual utilization rates between intra-urban green space and peri-urban green space at the city level in China
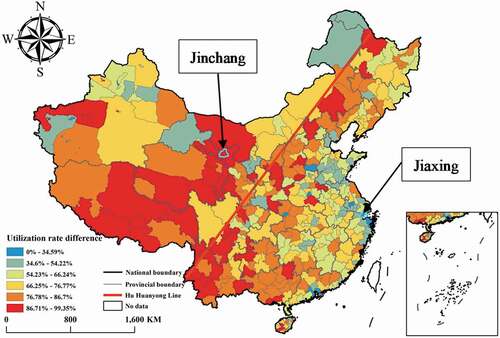
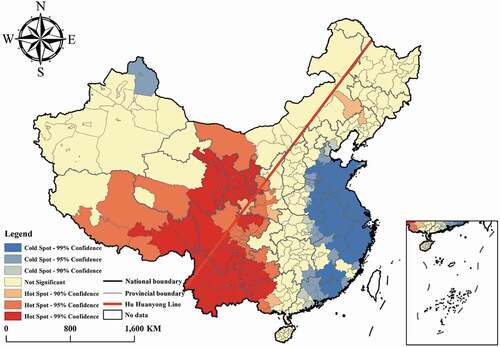
Figure 11. Hot spot analysis of actual utilization rate difference between intra-urban green space and peri-urban green space at the city level in China
Data availability statement
The data that support the findings of this study are openly available in ScienceDB at https://doi.org/10.11922/sciencedb.j00076.00076.