Figures & data
Figure 1. Hungarian policy, institutions, forums and financial arrangements of Sustainable Developments (SD) as a framework for EO and GI monitoring and reporting of the status of SDGs
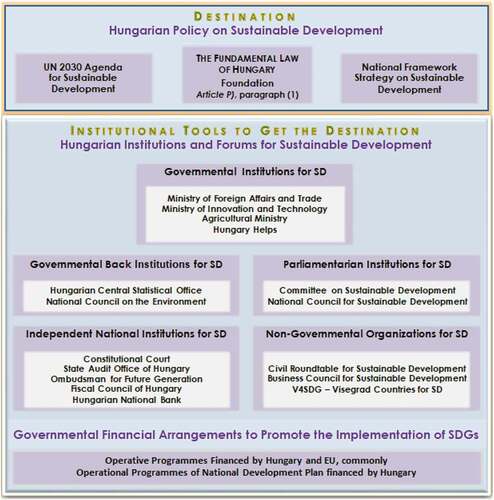
Figure 2. Hungarian GI and EO organizations facilitating the sustainability
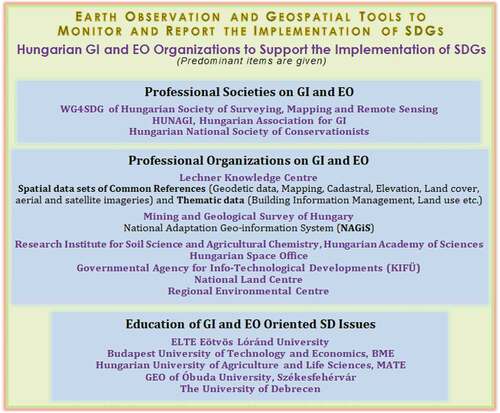
Figure 3. The first Masat-1 CubeSat captured photographs from space on 14th of March, 2012

Figure 4. Hungarian lake on Tisza River, May 2018, Sentinel-2 satellite imagery in true colour and false-coloured infrared
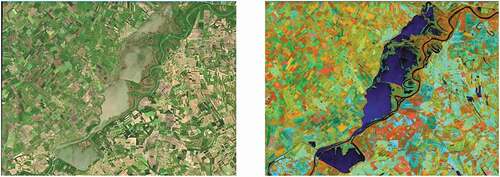
Figure 5. Fragment from the Hungarian Land Parcel Identification System
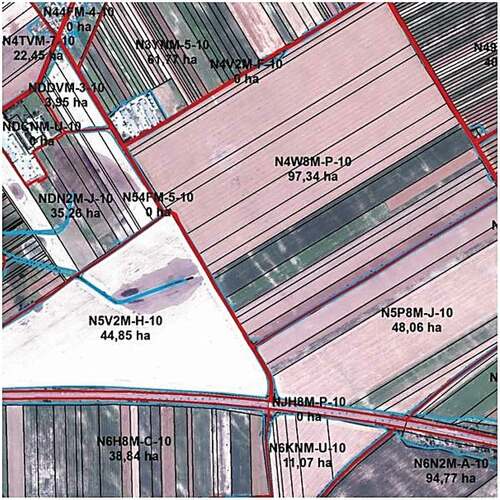
Figure 6. Comparison of details of CORINE Land Cover status between 2000 and 2006
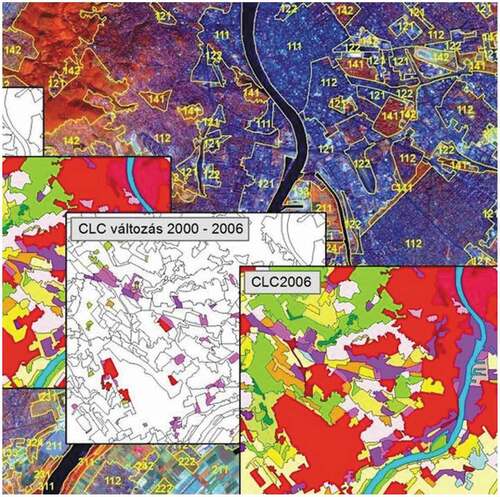
Figure 7. Global change potential of land use till the year 2050 including 5 categories
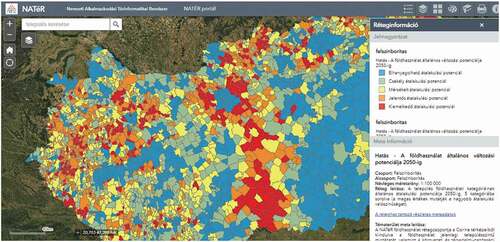
Figure 9. Hungarian INSPIRE metadata portal. Source: www.inspire.gov.hu
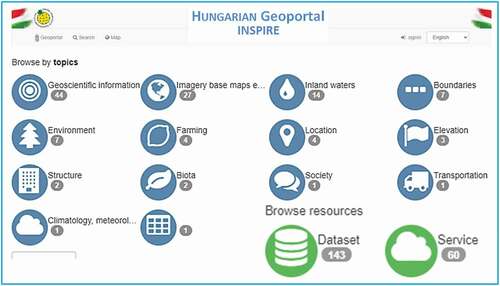
Figure 10. Layout of a novel, digital soil property map. Source: www.dosoremi.hu
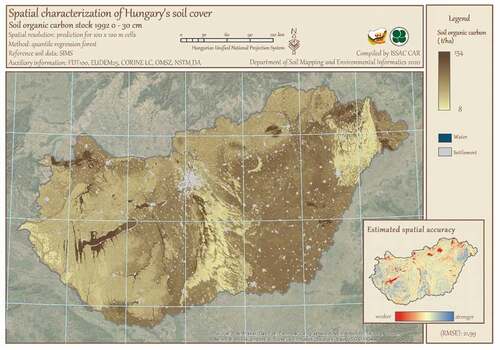
Figure 11. The theory of the system operation
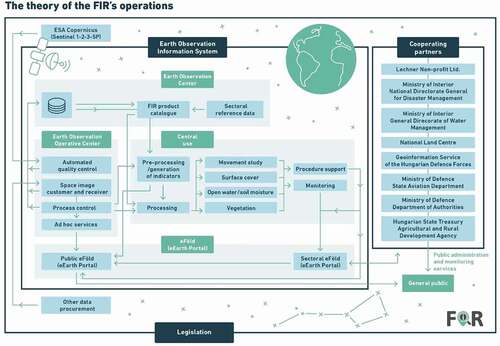
Figure 12. Some end products obtained from the Earth Observation Information System. Top left: statistics on forest stand map; bottom left: data series of a disbursement point analyzed with Persistent Scatterer Interferometric Synthetic Aperture Radar (PSInSAR); middle: forest using statistics based on NDVI change; top right: statistics on inland excess water map; bottom right: hybrid fire index map
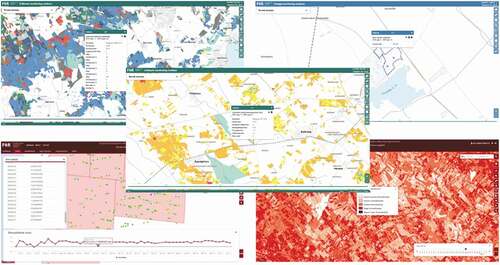
Figure 13. EO data volume trends of selected relevant US and European satellite missions from Sudmanns, Lang, and Tiede (Citation2018)
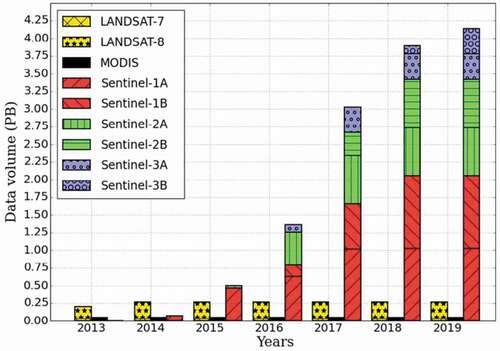
Figure 14. Simple three-dimensional illustration of the observed displacements showing the motion and the consequent deformation of the structure at a red mud reservoir in Kolontár, Hungary, by using Permanent Scatterer (PS) interferometry. From Grenerczy and Wegmüller (Citation2013)
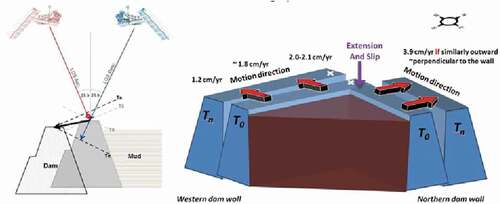
Figure 15. Subset from the National High Resolution Land Cover (nHRL) under preparation, provided by R. Pataki. From Kristóf et al. (Citation2019)
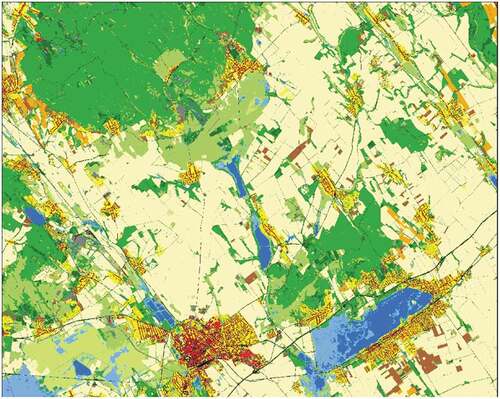
Figure 16. Ecosystem Map of Hungary.Footnote19 The underlying data set was integrated from a variety of EO and non-EO data sources with a resolution of 20 m over the whole national territory. It will serve as a basis for change detection and monitoring as well as for the assessment of ecosystem services
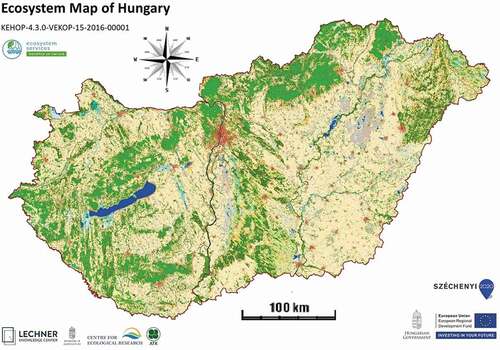
Figure 17. SDG Dashboard – 2019 assessment of Hungary (SDSN & IEEP, Citation2019)

Figure 18. SDG 2019 Trends – Hungary (SDSN & IEEP, Citation2019)