
Figures & data
Figure 1. Sample cities identified as lying within urban agglomerations along with their population sizes.
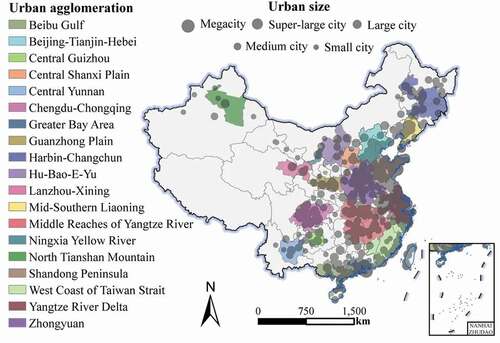
Table 1. List of data sources with details of providers and how to access the data
Figure 2. The proposed methodological framework for the extraction of large-area impervious surface area (ISA) products in urban areas using different data sources and mapping methods. PISA: potential impervious surface area; PISA_bare: potential impervious surface area in arid and semi-arid regions; HISA: high-brightness impervious surface area; TISA: target impervious surface area; UISA: urban impervious surface area.
Figure 3. Flowchart showing the process of converting the urban impervious surface area (UISA) map to the built-up area product for cities in China.
Figure 4. Spatial expansion in the impervious surface area (ISA) and urban built-up area compared with google earth images in 2015 for three representative cities: a) Shenyang City (Liaoning Province); b) Chengdu City (Sichuan Province); c) Changji City (Xinjiang Uygur Autonomous Region). the white boundaries superimposed on the Google Earth images are from the dataset that we generated for 2015.
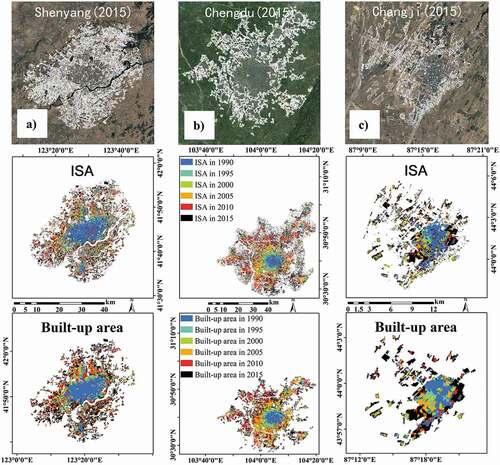
Figure 5. Distribution of validation points for the 1990–2010 urban impervious surface area (UISA) products of 433 chinese cities with populations over 300,000. The black rectangles mark the location of the urban extent polygons of Chengdu City (Sichuan Province) and Shenyang City (Liaoning Province).
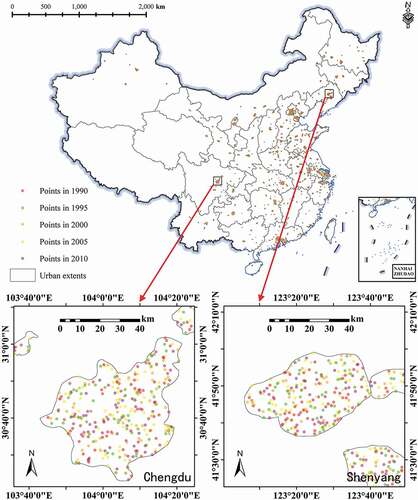
Figure 6. The average overall accuracy (OA), producer’s accuracy (PA) and user’s accuracy (UA) of the urban impervious surface area (UISA) product for each period.
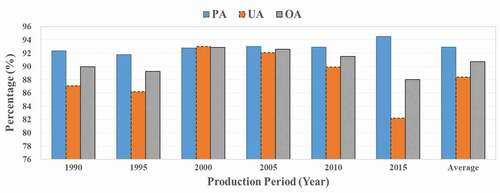
Figure 7. Scatter plots for matched cities with each point representing an estimate of a built-up area derived from SUBAD-China and datasets produced by the National Bureau of Statistics of China and the World Bank: a) National Bureau of Statistics of China against SUBAD–China for 2000; b) National Bureau of Statistics of China against SUBAD–China for 2010; c) World Bank against SUBAD–China for 2000; d) World Bank against SUBAD–China for 2010.
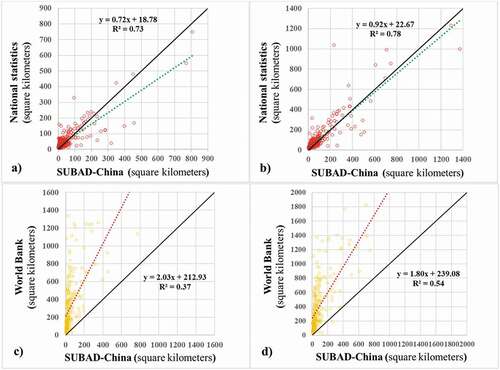
Figure 8. Spatially detailed results of a comparison between the estimated built-up area derived from our dataset and the world bank dataset for three representative cities: a) Lanzhou City (Gansu Province), b) Yuxi City (Yunnan Province) and c) Nantong City (Jiangsu Province). The white boundaries superimposed on the Google Earth images are the boundaries for the corresponding years generated using our dataset.
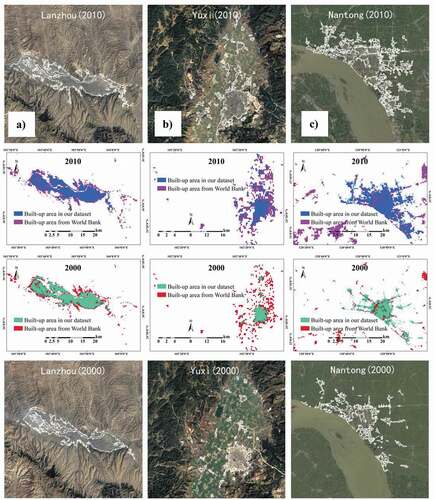
Figure 9. Line charts of matched cities with built-up area estimates derived from the UN-Habitat, SUBAD-China and National Bureau of Statistics of China datasets for a) 1990; b) 2000 and c) 2015.
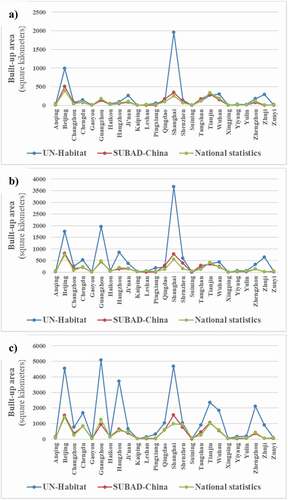
Table 2. Classification of cities in China based on the ratio of land consumption rate to population growth rate (LCRPGR) distribution
Figure 10. Spatiotemporal evolution of the ratio of the land consumption rate to the population growth rate (LCRPGR) in China from 1990 to 2015: a) plot of the LCRPGR and b) proportions of the number of cities in different LCRPGR classes.
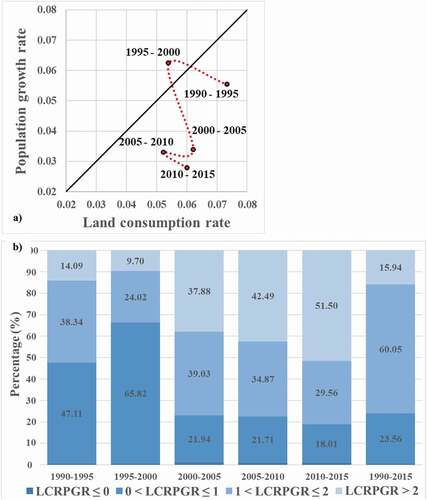
Table 3. List of 19 urban agglomerations in China
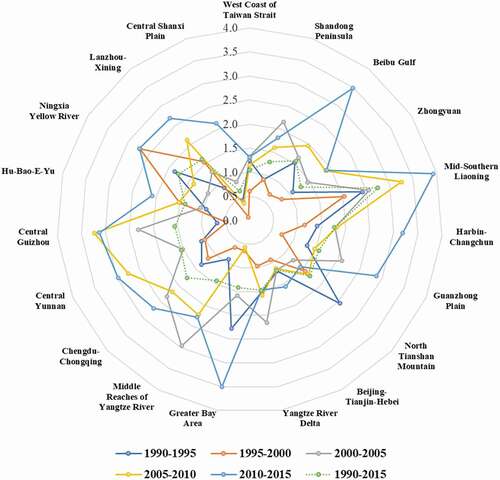
Figure 11. Distribution of the ratio of the land consumption rate to the population growth rate (LCRPGR) for different urban agglomerations grouped by time period.
Data availability statement
The data described in this article are openly available in the Open Science Framework at http://www.doi.org/10.11922/sciencedb.j00076.00004.