
Figures & data
Figure 1. Overall framework of marine big data management and application service system. The green numbers (1, 2, and 3) represent the three platforms of the system. The contents of the orange numbers will be described in Sections 3.1 and 3.2
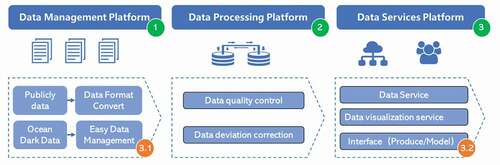
Figure 2. Marine data retrieval and download service interface (msdc.qdio.ac.cn/search-field). The left side includes the query conditions and the right side shows the query results
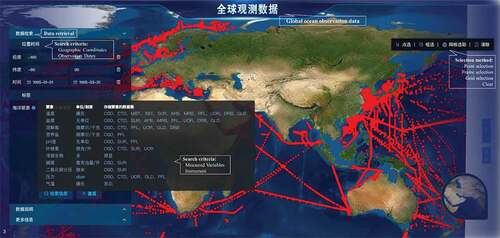
Figure 3. The architecture of the marine big data management and application service system
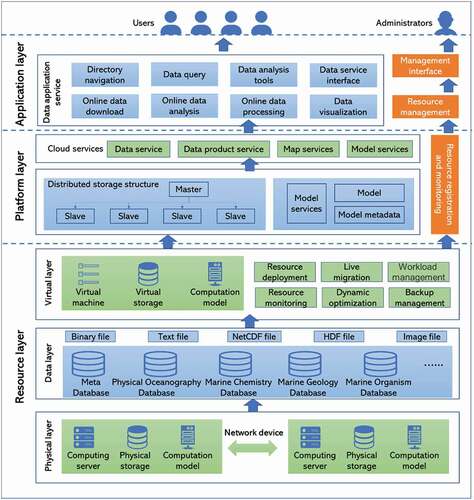
Figure 4. Workflow of ocean dark data management by different users using EasyDM system
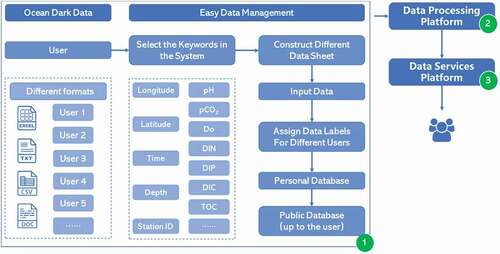
Figure 5. The pCO2 data products based on this platform (Wang et al., Citation2021). a) Mean Sea surface CO2 fluxes (Pg C) in 2000, 2005, 2010, 2015 in the Southern Ocean. b) Trends in CO2 flux of the Southern Ocean during 2000–2015
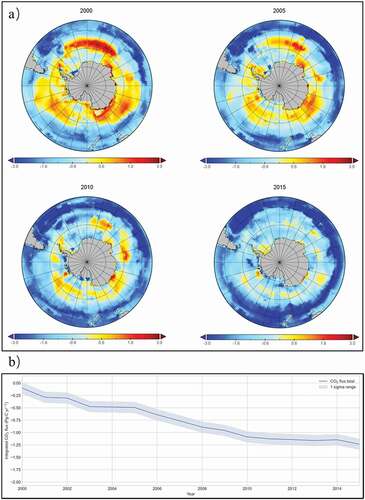
Figure 6. Development process of marine data products based on this system
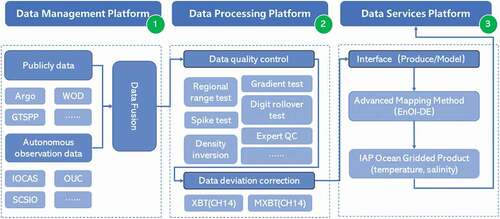
Figure 7. Global ocean temperature gridded data (Spatial resolution: 1°×1°; Temporal resolution: monthly mean; Vertical resolution: 0–2000 m, 41 layers). For example, water depth: a = 0 m; b = 50 m; c = 100 m; d = 300 m; time: July 2020
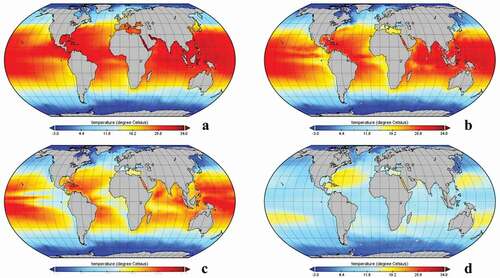
Figure 8. Data quality control by climate state check. The red dot is the data marked as an error
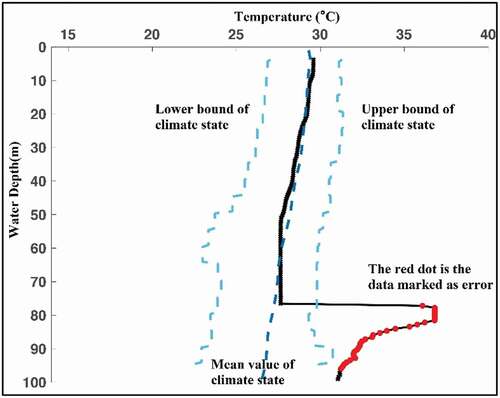
Figure 9. Comparison of quality control results for ocean temperature data: a) the original temperature observation data; b) data after NCEI data quality control; c) data after data quality control
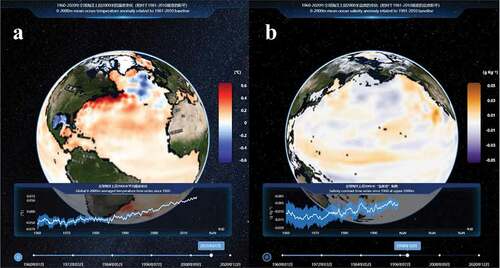
Figure 10. Global ocean gridded product and the visualization system: a) 0–2000 m mean ocean temperature anomaly related to 1981–2010 baseline; b) 0–2000 m mean ocean salinity anomaly related to 1981–2010 baseline
Data availability statement
The data that support the findings of this study are available in Marine Science Data Center, Chinese Academy of Sciences at http://msdc.qdio.ac.cn. These data were derived from the following resources available in the public domain:
1. Partial pressure of carbon dioxide in Southern Ocean: http://english.casodc.com/data/metadata-special-detail?id=1409813943244832769; and
2. Global Ocean temperature grid data product: http://english.casodc.com/data/metadata-special-detail?id=3.