
Figures & data
Figure 1. Spatial distribution of NPCs and non-NPCs
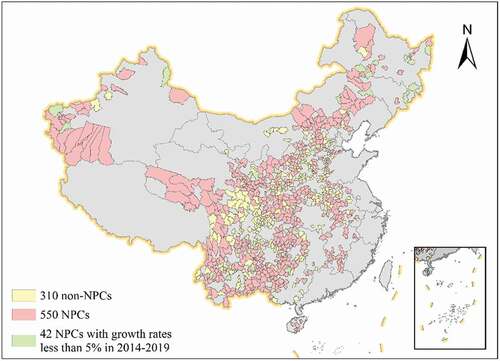
Figure 2. (a) Framework of our deep learning model; (b) Structure of our deep neural network
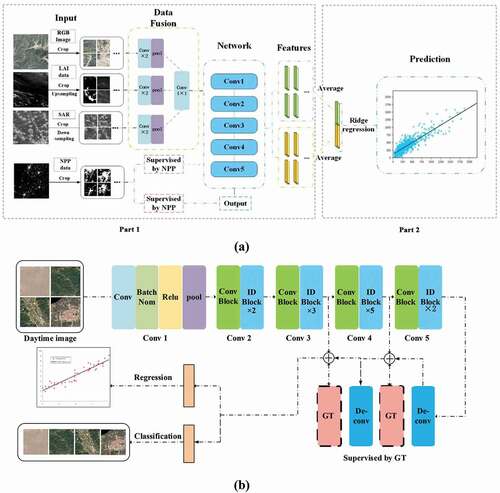
Figure 3. Visualization of the extracted features. The first row illustrates four object categories in remote sensing images: farmland, town, river and road. The second row shows the features of the four objects learned by our method from the corresponding images in the first row
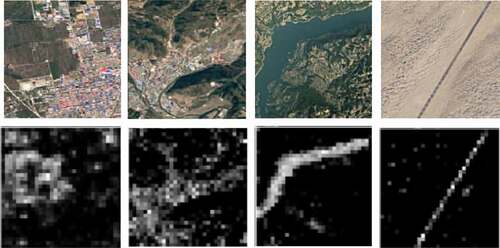
Figure 4. Average AGR-pcGDP of the NPCs in each quantile range and their respective non-NPCs. Error bars indicate 1 standard deviation across the counties
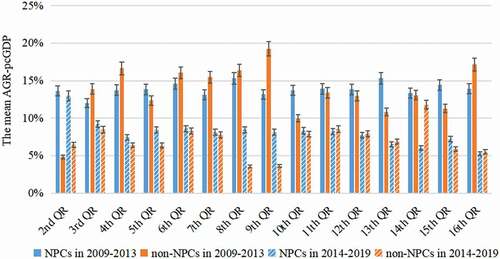
Figure 5. Average AGR-pcGDPs for the NPCs and non-NPCs in the four provinces. Error bars indicate 1 standard deviation across the counties. The provincial growth rates data are obtained directly from the China Statistical Yearbook for comparison
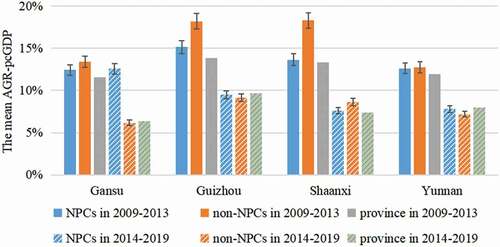
Figure 6. AGR-pcGDP of 592 NPCs, 310 adjacent non-NPCs, and the whole country over 2009–2019. Error bars indicate 1 standard deviation across the counties. The national data are taken directly from the Statistical Yearbooks
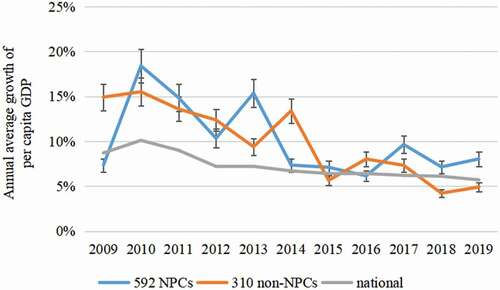
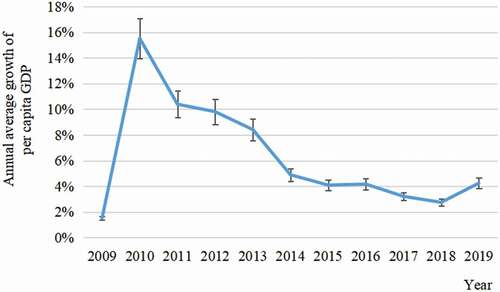
Figure 7. Variations in the average AGR-pcGDP of the 42 NPCs with weak growth. Error bars indicate 1 standard deviation across the counties
Supplemental Material
Download PDF (530.2 KB)Data availability statement
The Per capita GDP results and growth rates at different levels are available at https: 10.6084/m9.figshare.15052545 and https://www.doi.org/10.11922/sciencedb.j00076.00089.