
Figures & data
Figure 1. Location and elevation of Switzerland and its six biogeographical regions
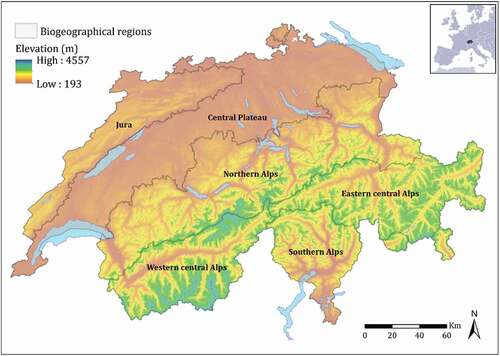
Figure 2. Analytical framework of the study
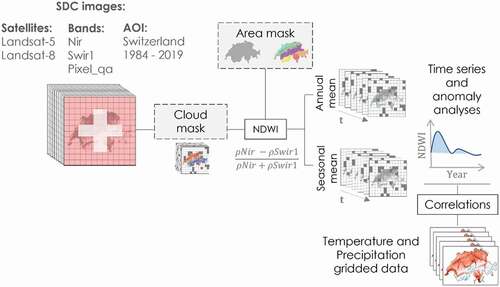
Table 1. Characteristics of Landsat data used to compute NDWI
Figure 3. Percentage of clear observations per pixel across Switzerland for the 1984–2019 period for the annual (top) and seasonal mean (DJF, MAM, JJA, SON). White areas indicate pixels with less than 10% of clear observations over the study period
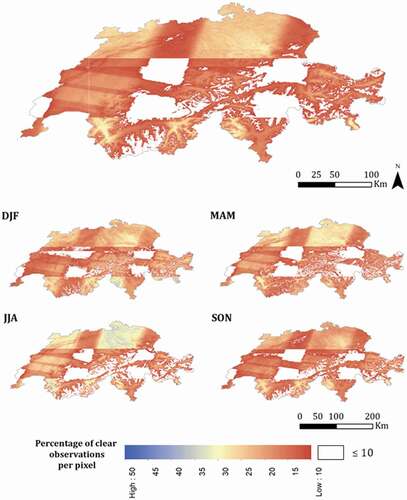
Table 2. Classification of NDWI z-score anomaly values based on the methodology of Meroni et al. (Citation2019)
Figure 4. Spatial distribution of mean annual average temperature and mean annual sum of precipitation for the period 1984–2018 across Switzerland. White areas indicate pixels with less than 10% of clear observations over the study area
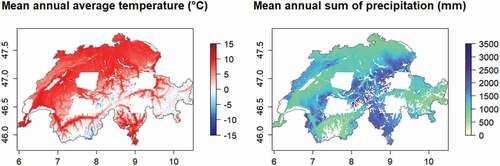
Figure 5. (A) Overall mean annual NDWI, and (B) Annual NDWI significant slope at the 95% significance level over the period 1984–2019 across Switzerland
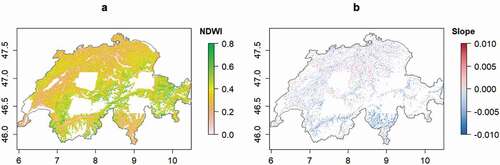
Figure 6. Relation between NDWI change and elevation across Switzerland over the period 1984–2018
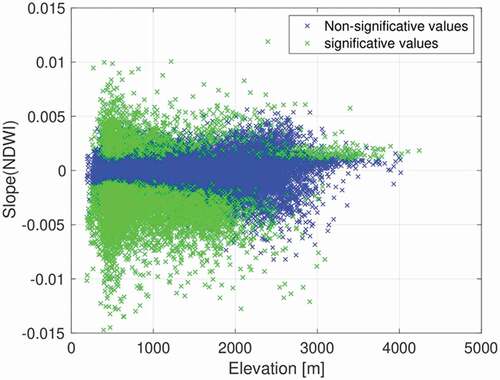
Figure 7. Mean Annual NDWI (solid line) and Mean Seasonal NDWI (dashed line) trend for Switzerland for the period 1984–2019. The light grey area represents the mean standard deviation per year. The regression line is illustrated in red
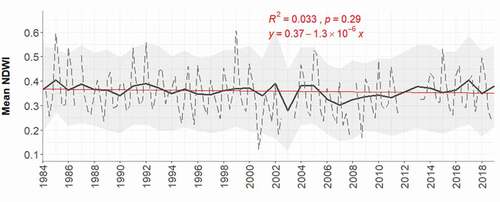
Table 3. Linear regression coefficient and Mann Kendall coefficient for the mean annual NDWI time series for the six biogeographical regions. The (*) indicate statistically significant tau correlation at 95% confidence level (p-value < 0.05)
Figure 8. Mean Annual NDWI trend for the six biogeographical regions for the period 1984–2019
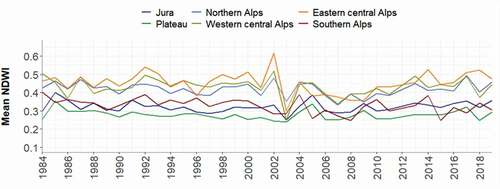
Table 4. Linear regression coefficient and Mann Kendall coefficient for the mean seasonal NDWI time series for Switzerland
Figure 9. Mean Seasonal NDWI trend for Switzerland for the period 1984–2019
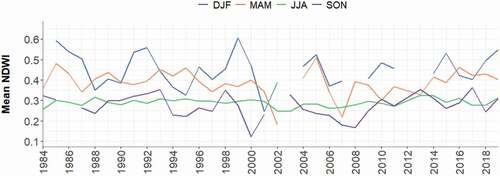
Figure 10. Mean Seasonal NDWI trends by biogeographical regions for the period 1984–2019
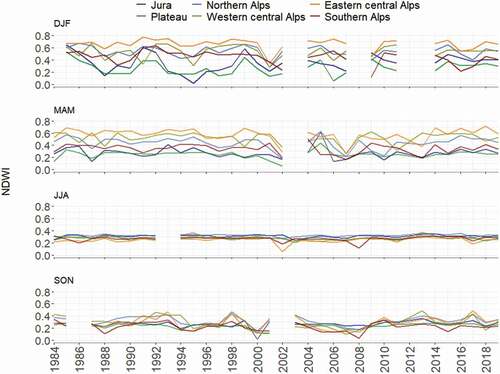
Figure 11. Mean Annual NDWI z-score anomalies for Switzerland for the period 1984–2019. Pixel classes are based on the classification of .Meroni et al. (Citation2019)
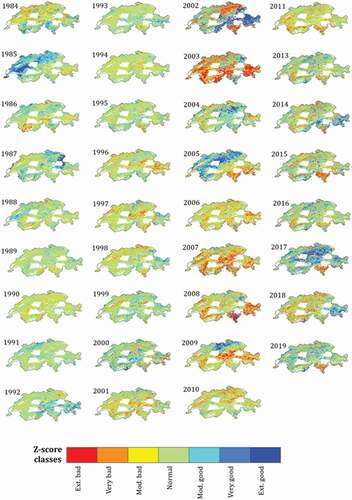
Figure 12. Mean Seasonal NDWI absolute anomalies for the years 2003 and 2018 compared to the entire summer studied (1984–2019) across Switzerland
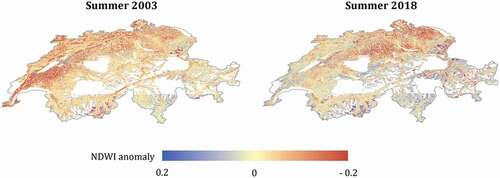
Table 5. Mean NDWI values and anomalies for Switzerland and the six biogeographical regions by decades. The baseline period is 1984–1994. Shaded boxes show negative NDWI z-scores, while whited boxes indicate positive NDWI z-scores
Table 6. Correlation results between annual and seasonal NDWI and weather variables ((A) temperature and (B) precipitation) at national and biogeographical scale for the period 1984–2018. The (*) indicate statistically significant correlation at 95% confidence level (p-value < 0.05).
Figure 13. Pixel-wise correlation between annual mean NDWI, annual mean temperature (A) and annual precipitation (B) over the period 1984–2018. Only significant pixel (correlation at 95% confidence level (p-value < 0.05)) are shown in the image
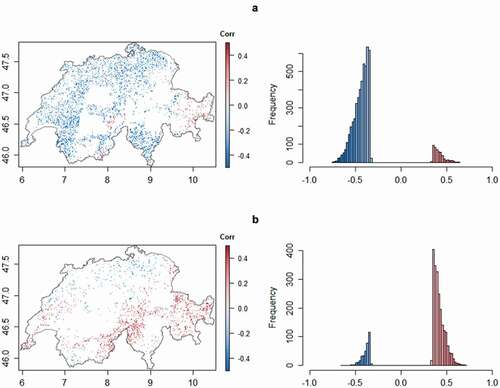
Figure 14. Relation between correlations of annual mean NDWI and weather variables ((A) annual mean temperature and (B) annual precipitation) and elevation across Switzerland over the period 1984–2018
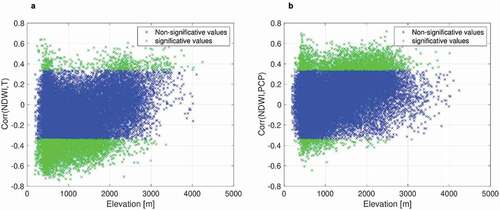
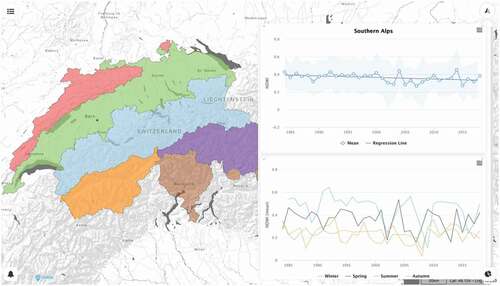
Figure 15. NDWI information dashboard showing NDWI annual and seasonal time-series at biogeographical scale in the MapX platform
Data availability statement
The NDWI time-series data that support the findings of this study are openly available at https://doi.org/10.26037/yareta:xzczpcai2nbp5l4na7rx2oelse and https://doi.org/10.26037/yareta:bwtgg2z5cbhf3e47rugqhmhgui. Temperature (TabsM and TabsY) and precipitation (RhiresM and RhiresY) dataset from the MeteoSwiss platform – Spatial Climate Analysis data are available for registered users at: https://www.meteoswiss.admin.ch/home/climate/swiss-climate-in-detail/raeumliche-klimaanalysen.html.