
Figures & data
Figure 1. The MODIS image of Prydz Bay, East Antarctica (24 September 2015), modified from the figure in Zhao et al. (Citation2020). The domain of FIPS V2.0 is denoted by the black rectangle. The fast ice region is denoted by the red border. The in-situ observation site (SIP) is denoted by the red dot, which is located about 100 m off the coast.
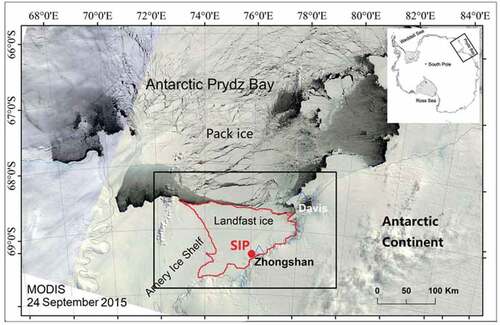
Table 1. The parameters applied in the HIGHTSI model.
Figure 2. Measuring the (a) thick ice (> 1 m), (b) thin ice (< 1 m), and (c) snow on the fast ice near Zhongshan Station, conducted by the winter team members.
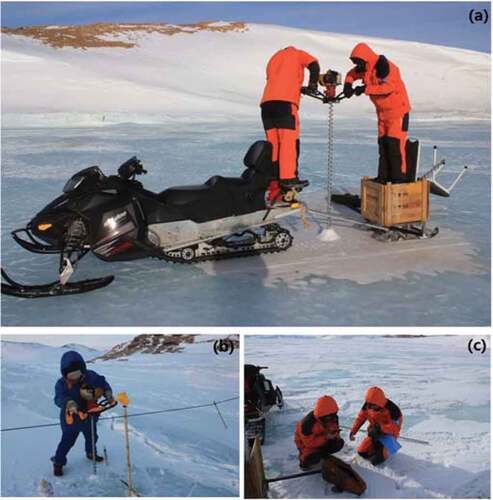
Figure 3. Comparisons of the (a) wind speed (Va), (b) air temperature (Ta), (c) relative humidity (Rh), and (d) cloudiness (CN) from the ERA-Interim and Zhongshan AWS observations, averaged from 2012 to 2016. The line and the shaded areas represent the multi-year mean and standard deviation, respectively.
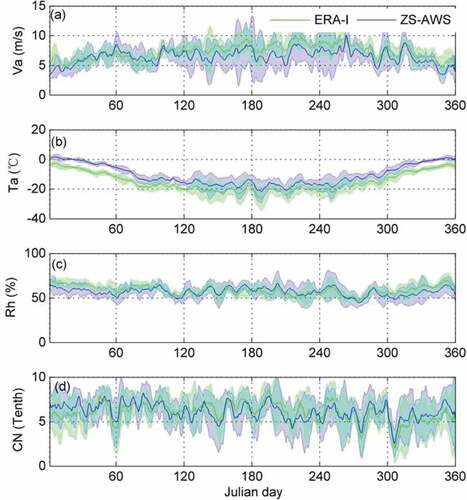
Figure 4. Mean snow and ice thicknesses from FIPS V2.0 in November when the ice thickness usually reaches the maximum and when CHINARE arrives in this region for the annual logistical supply.
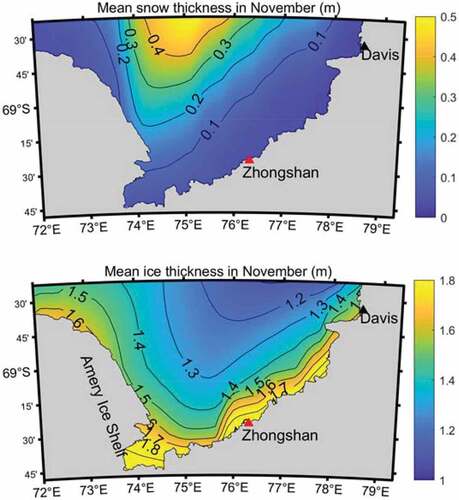
Figure 5. Weekly mean snow and ice thicknesses at the SIP grid from FIPS V2.0 simulations, averaged from 2012 to 2016, compared to the in-situ observations.
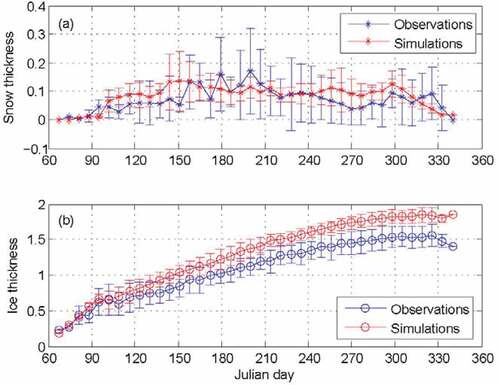
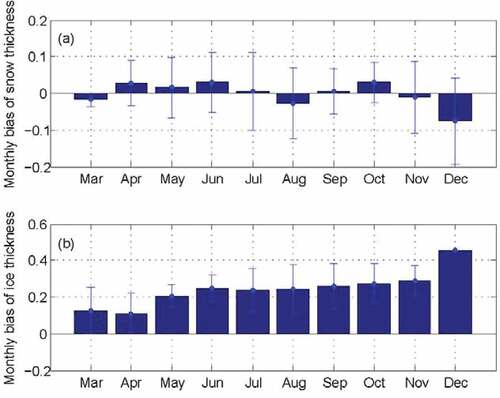
Figure 6. Monthly mean biases of the snow and ice thicknesses at the SIP grid from FIPS V2.0 simulations, averaged from 2012 to 2016.
Data availability statement
The dataset is openly available in the Science Data Bank at http://www.doi.org/10.11922/sciencedb.j00076.00066.