
Figures & data
Table 1. Main service organizations and institutions for Arctic sea ice conditions and meteorological information (the last visit to the websites was on December 22, 2020).
Figure 1. Overall framework of the SNISS.
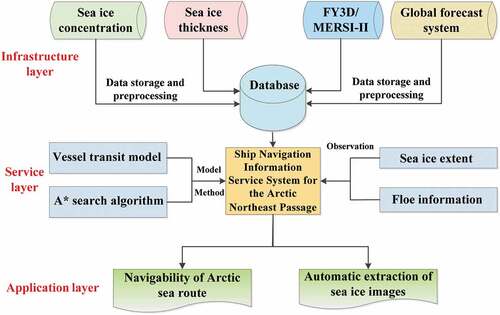
Table 2. Main technologies of the secondary development engine.
Figure 2. The distribution of Arctic routes.
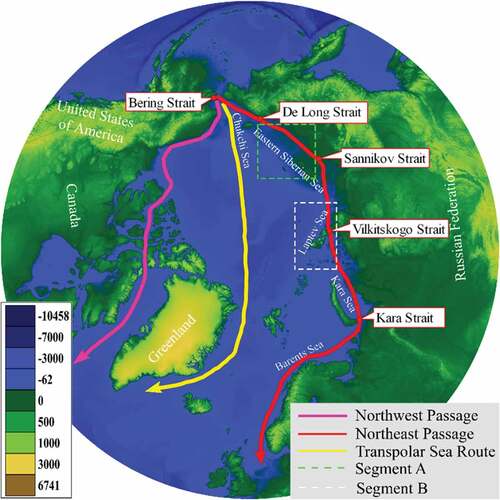
Table 3. Main data used in this study (the information in this table was updated on August 1, 2021).
Figure 3. Regular grids with different projections (blue represents oceans, and yellow represents land). (a) Regular grid (WGS 1984 World Mercator). (b) Regular grid (North Pole Orthographic).
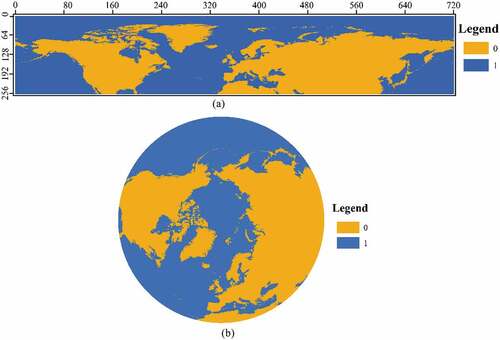
Table 4. Main three bands of FY-3D/MERSI-II used in this work and its application and physical parameters.
Figure 4. Spatial distribution of the risk index outcome (RIO) for a merchant ship on October 15, 2019.
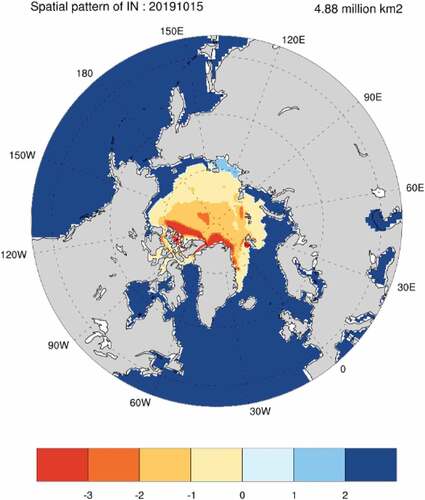
Figure 5. Optimal route extraction results. The coordinates in the figure represent the row and column numbers of the data; the green grid is the starting point and the red grid is the end point; yellow grids represent lands, light blue grids represent regions with positive RIO and pink ones represents regions with negative RIO.
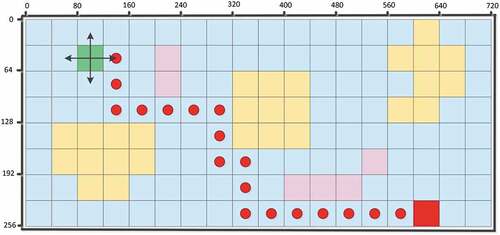
Figure 6. Optimal route analysis interface (http://arcticroute.tpdc.ac.cn/encesium_index/?type=1&locale=en). Users can select the date for which the distribution of the optimal route is displayed. In figure (a), A: the yellow line on the map is the optimal route calculated by the system for merchant ships sailing in the NEP on July 15, 2020; the map colours represent the RIO for merchant ships on this day. C: visualization of sea ice concentration and thickness along the NEP. D: ten- to fifteen-day temperature forecast along the optimal route. In figure (b), B: the buffer zone where ships can navigate safely.
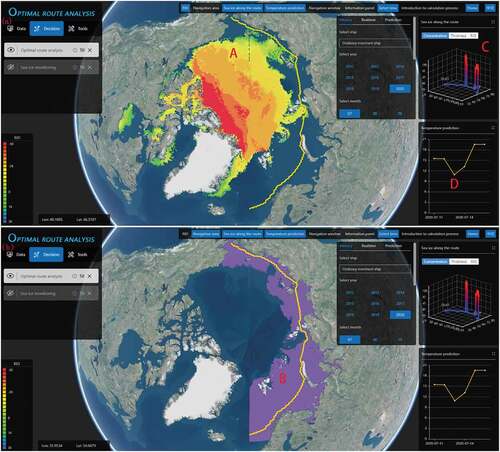
Figure 7. Automatic extraction process of sea ice image.
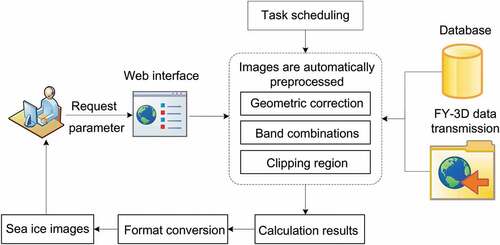
Figure 8. Drawing a rectangle to select a region of interest (http://arcticroute.tpdc.ac.cn/encesium_index/?type=2&locale=en).
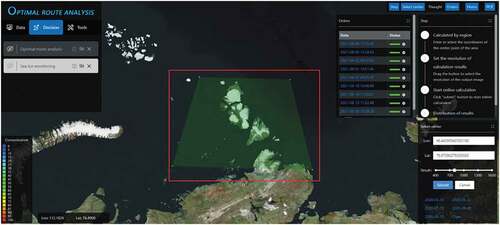
Figure 9. The online calculation results are automatically displayed in the spherical system.
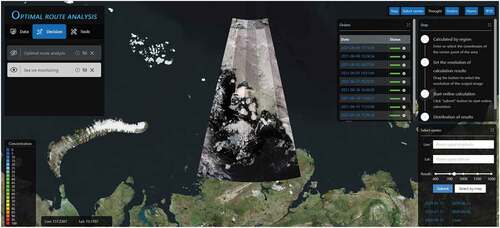
Table 5. Comparison between SNISS and route planning system using Google Earth.
Data availability statement
Data are openly available in a public repository that does not issue DOIs. The sea ice concentration data from 2012 to present are openly available at https://nsidc.org/data/G10005/versions/1, and the sea ice thickness data from 2012 to present are openly available at http://psc.apl.uw.edu/research/projects/arctic-sea-ice-volume-anomaly/data/model_grid. In addition, climate projections of the sea ice conditions are openly available at https://cds.climate.copernicus.eu/cdsapp#!/dataset/sis-shipping-arctic?tab=overview.