
Figures & data
Table 1. Main SST datasets derived from remote-sensing data.
Figure 1. Diagram showing an example from GDPoSSTA.
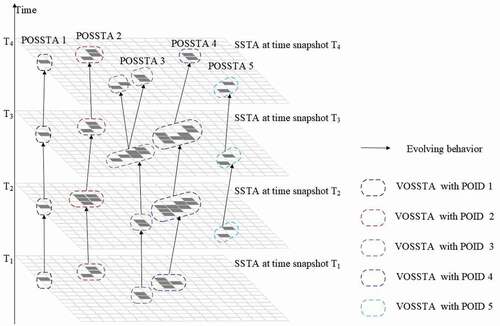
Figure 2. Workflow used to produce GDPoSSTA.
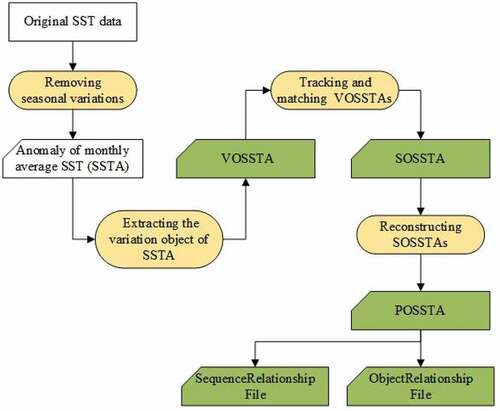
Figure 3. Spatial distribution of the 87 POSSTAs in the global ocean for the period January 1982 to December 2009. Different colors represent different POSSTAs.
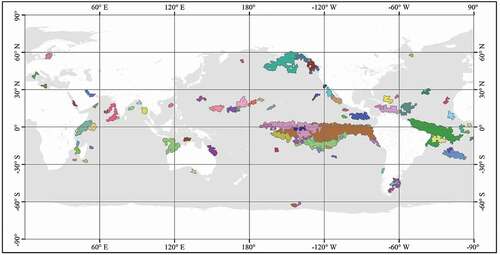
Table 2. Fields in ProcessObjectDatasets.shp.
Table 3. Fields in SequenceObjectDatasets.shp.
Table 4. Fields in VariationObjectDatasets.shp.
Table 5. Fields in SequenceRelationship.csv.
Table 6. Fields in ObjectRelationship.csv.
Table 7. Details of the files contained in the ScienceDB record.
Figure 4. Comparison of the spatial distribution of VOSSTAs identified using the proposed DcSTCA and k-Standard Deviation. (a) VOSSTAs retrieved from an SST dataset from March 1983 using the proposed algorithm DsSTCA. (b) Comparison of VOSSTAs identified by the k-Standard Deviation algorithm and the proposed algorithm for k equals 1 and 2 (zoomed in part of (a)).
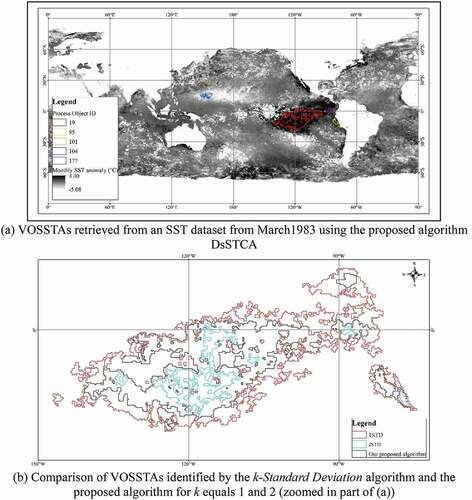
Table 8. Comparison of the tracking of process objects by the proposed PoAIR algorithm and TITAN (Modified from Figure 9 and in Xue et al. (Citation2019b)).
Table 9. Comparison of identified evolving behaviors by the proposed PoAIR algorithm and TITAN.
Figure 5. The POSSTA that was selected for analysis. The black polygons denote VOSSTAs; the arrows denote the evolution of the VOSSTAs. A total of six evolutionary sequences are shown by the six colored lines. The background is the monthly SSTA.
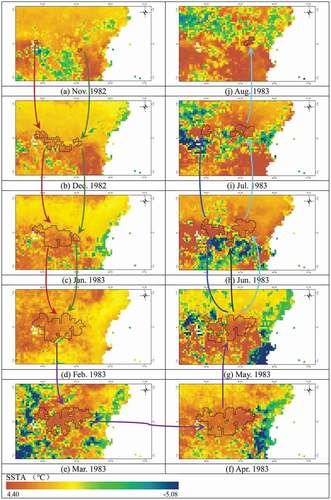
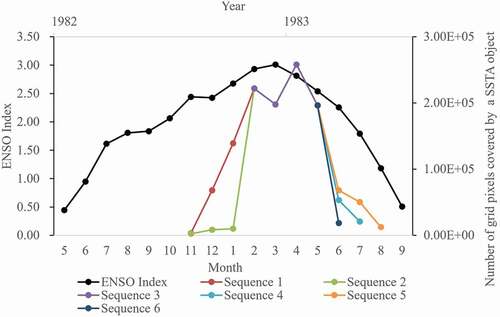
Figure 6. Graph showing the close relationship between the selected POSSTA and an ENSO event.
Data Availability Statement
The data that support the findings of this study are openly available in ScienceDB at http://www.doi.org/10.11922/sciencedb.j00076.00090.