
Figures & data
Figure 1. The architecture of the visualization framework. The numbers in brackets refer to the sections where the components are introduced in detail.
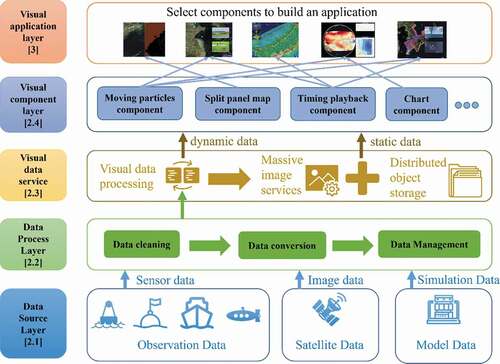
Figure 2. The ocean science data included in our system included ocean observation data (from buoys, ship surveys etc.), satellite data (acquired by MODIS, Landsat etc.), and model data (e.g. ROMS and GLOMS data).
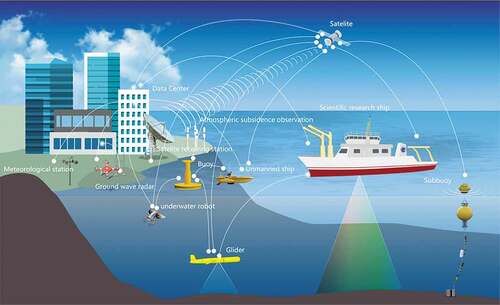
Figure 3. Spatial data classification including (a) point data, (b) line data, (c) section data and (d) volume data. The horizontal line denotes the timeline and is representative of dynamic data changes over time.
Figure 4. Similar pyramid image service structure.
Table 1. Data encoding format.
Figure 5. Basic interactions between interative component and display component. The user initiates the request using the browser (①); this is then transmitted to the control terminal by the interactive component (②). The control terminal searches the data according to the requested content and returns it (③, ④, ⑤, and ⑥) . After the data have been obtained, the control terminal renders the data to the document object model through the visual component (⑦) and finally returns the result to the user (⑧).
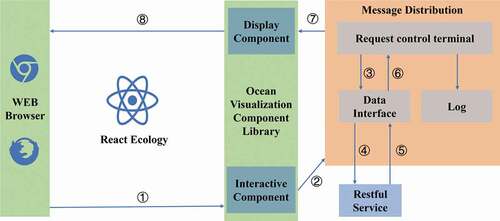
Figure 6. Moving particle component: part (a) displays the effect of ocean currents; part (b) relates to the interactive control components of moving particles (http://casearthocean.qdio.ac.cn/oceanVisual_latest/#Current).
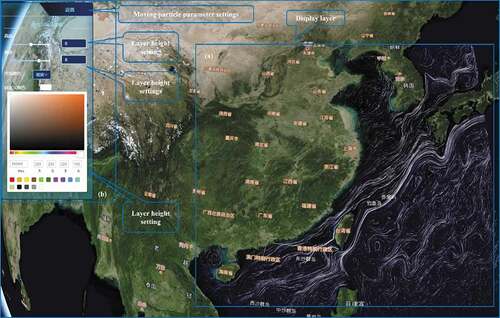
Figure 7. Operating process of the early warning and forecasting system for coastal dikes in Fujian.
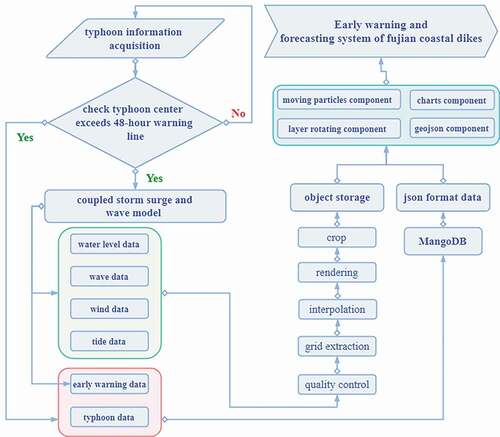
Figure 8. Use of the marine component library to build a service application: an early warning and forecasting system for coastal dikes in Fujian: (a) UI component, (b) chart component, (c) moving particle component, (d) rotating layers component, (e) 3D graphics component, (f) table component and (g) GeoJSON line component. (http://casearthocean.qdio.ac.cn/oceanVisual_latest/#RealTimeCurrent).
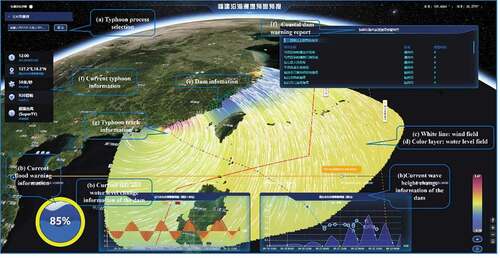
Figure 9. The operating process of the marine ranch information system. Monitoring data are stored in the MangoDB database after quality control and data conversion, and model data are directly stored in the database. The panel layout components, chart components, GeoJSON components, and streaming components obtain data and then combine these to form a marine ranch information system.
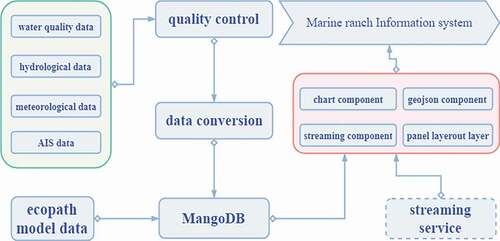
Figure 10. The use of a marine components library to construct a marine ranch environmental information monitoring system: (a) table component, (b) chart component, (c) streaming component and (d) GeoJSON point component. (http://casearthocean.qdio.ac.cn/oceanVisual_latest/#OceanRanch).
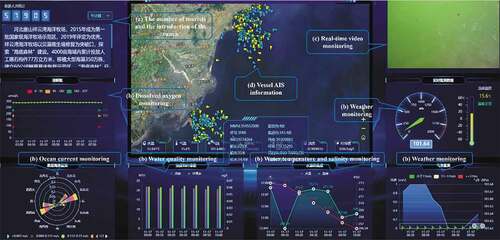
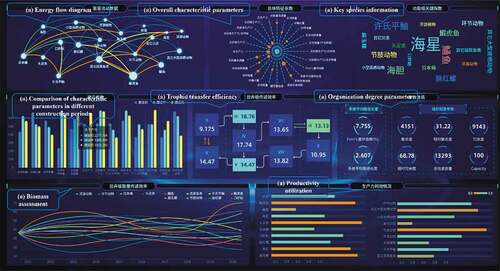
Figure 11. The use of a marine components library to build a marine ranch decision-support information system: (a) Chart component.
Data availability statement
The data that support the findings of this study :
1.Typhoon path data: http://english.casodc.com/data/metadata-special-detail?id=1422760211214520321
2.Ocean current data: http://159.226.158.60/current/ydz.php
3.Storm surge data: http://casearthocean.qdio.ac.cn/oceanStorm/#RealTimeCurrent