
Figures & data
Figure 1. The S1 EW sub-images in HH polarization acquired by S1A at 7:47 UTC on 1 December 2018 in the Norwegian sea presenting a mixture of sea ice (upper-left corner) and open water, in which wind streaks are visible. The wave-like patterns are visible in the zoomed sub-image (right panel). the image ID is S1A_EW_GRDM_1SDH_20181201T074714_20181201T074814_024829_02BBC2_BE2B.SAFE.
Figure 2. Amount of S1 EW images processed in the pan-Arctic ocean for producing wind and wave products in each month through January 2017 to May 2021.
Table 1. Cross-comparison of SWH data between June 2018 and June 2020 from the four RA missions over the pan-Arctic ocean.
Table 2. Cross-comparison of SSWS data between June 2018 and June 2020 from the four RA missions over the pan-Arctic ocean.
Table 3. Summary of the previous comparisons of S1 retrievals of SSWS and SWH with different reference data (Li, Qin, & Wu, Citation2020) and (Wu, Li, & Huang, Citation2021).
Figure 3. Flowchart of producing S1-based SSW and SWH data in the pan Arctic ocean.
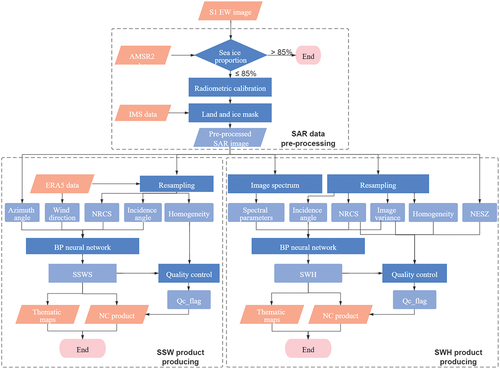
Figure 4. The topology structure of BP neural network used for retrieving SSWS or SWH by S1 data.
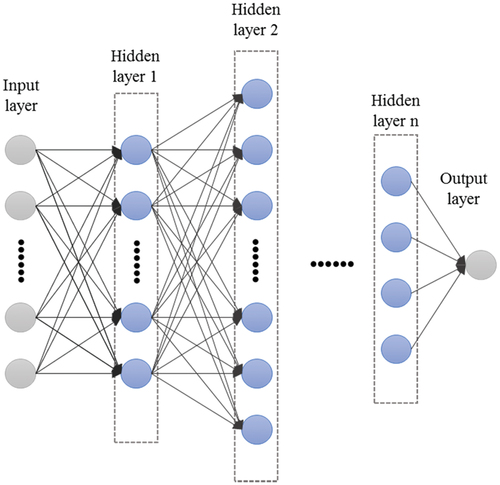
Table 4. List of variables and their descriptions in the S1 SSW and SWH products.
Table 5. Definition of quality control flags and their criteria for the SSW products.
Table 6. Definition of quality control flags and their criteria for the SWH products.
Figure 5. Examples of (a) SSW and (b) SWH products produced by S1 EW data acquired in the Arctic. the gray represents areas covered by sea ice. the image ID is S1A_EW_GRDM_1SDH_20201202T024920_20201202T025025_035501_042682_F0C5.
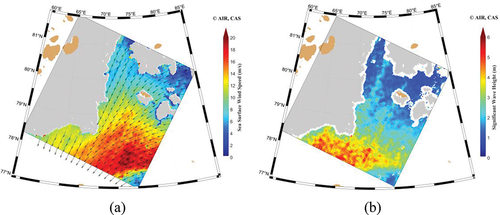
Table 7. Comparisons of SSWS by S1 with ASCAT/RA data for different homogeneity factors.
Figure 6. Comparisons of SSWS by S1 and the collocated (a) ASCAT and (b) RA from June 2018 to June 2020. The gray dots are the detected outliers by quartiles. The color indicates the amount of collocated data pairs. The error bars in an interval of 2 m/s are overlaid.
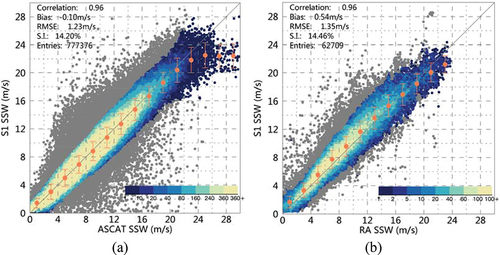
Table 8. Comparisons of the SSWS by S1 and RA from different missions.
Table 9. Comparisons of SWH by S1 with RA data with different combinations of homogeneity factor and image variance.
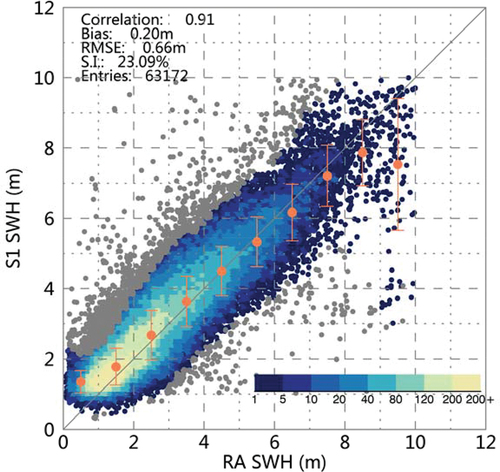
Figure 7. Comparison of SWH by S1 and the collocated RA during the period of June 2018 to June 2020. the gray dots are the outliers detected by quartiles. the color indicates the amount of collocated data pairs.
Data availability statement
This dataset is freely available at Science Data Bank http://www.dx.doi.org/10.11922/sciencedb.00834.