
Figures & data
Figure 1. Flowchart for construction of the emergency airport site selection algorithm.
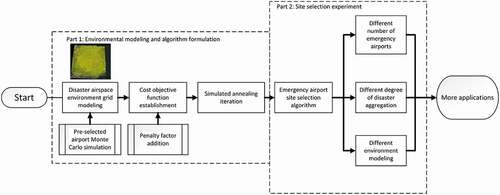
Figure 2. The coverage of different levels of airports. The yellow grid represents the coverage area of the airport; the darker the color is, the wider the coverage area of the airport. (a): Level 1 airport represented by the white grid; (b): Level 2 airport represented by the pink grid; (c): Level 3 airport represented by the purple grid.
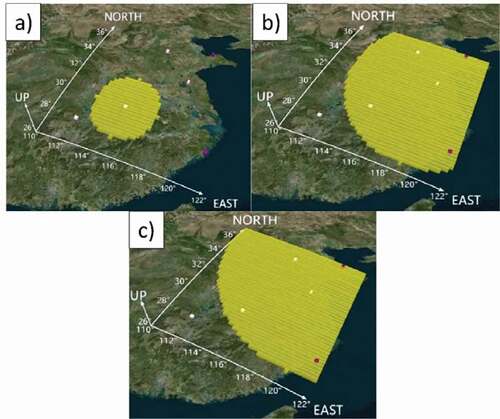
Table 1. The farthest coverage radius and the number of loaded aircraft in each type of airport.
Table 2. The impact of the distance between the airport and the disaster area on the airport.
Figure 3. Yangtze river delta airspace constructed using the GeoSOT-3D method. The blue grid points represent the preselected locations of the airport, and the black grid points refer to the disaster area locations. The yellow grid represents the coverage level of the grid by the airport; the darker the color is, the higher the level.
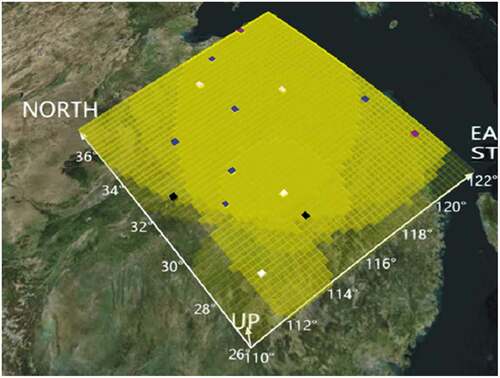
Figure 4. Structure of the GeoSOT-3D global subdivision grids. The 1st-level grid encoding order is shown in subfigure (a). The direction of the Z-order coding is determined by the locations of the 1st-level grids. An example of the encoding order is shown in subfigure (b).
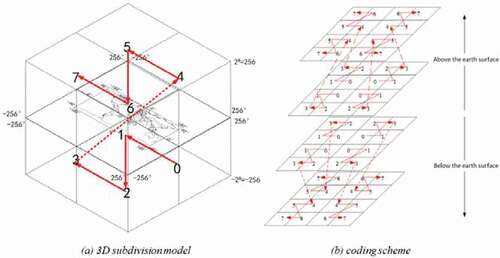
Figure 5. GeoSOT-3D airspace database management table.
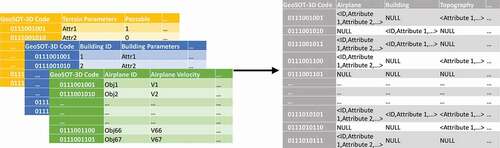
Figure 6. Airspace situation with different numbers of emergency airports (Level 11). In the figure, the yellow grid represents the coverage area of the original airport. The darker the color is, the higher the coverage level of the area. The red grid represents the emergency airport and its coverage. (a), (b), (c), and (d) represent the site selections formed by adding 1–4 emergency airports.
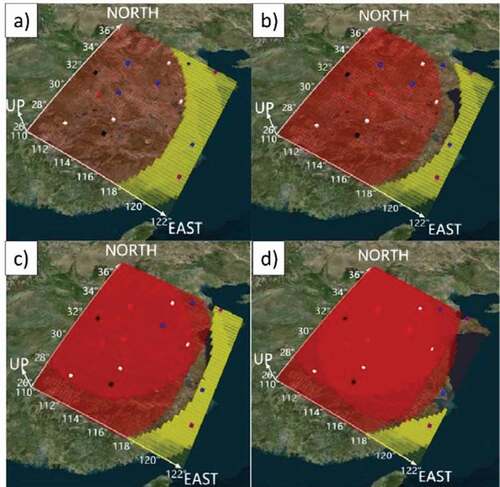
Figure 7. Impact of emergency airport changes.
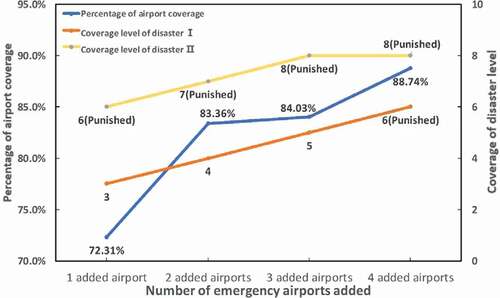
Figure 8. Site selection of emergency airports with different aggregations of disaster points. (a): Highly aggregated locations of two disaster areas; (b): Lowly aggregated locations of areas.
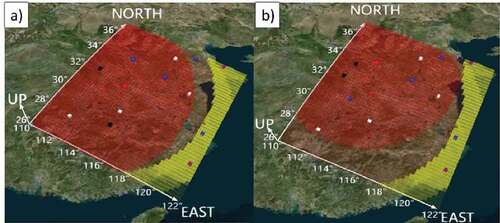
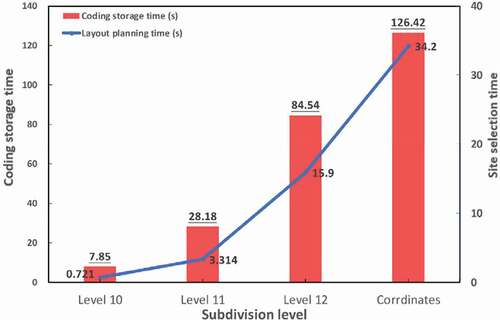
Figure 9. Time of storage consumption and site selection in an identical airspace.
Data availability statement
The data that support the findings of this study are available from the corresponding author upon reasonable request. Aggregated data of processing is available from 10.18170/DVN/9CR647.