
Figures & data
Table 1. The characteristics of shared spectral libraries integrated in RockSL.
Table 2. The metadata variables of data model in RockSL.
Figure 1. Data structure of the designed database schema. The relational table of mineral/rock code and mineral/rock type records the classification information. The table of mineral/rock attribute records the physical and chemical properties, while spectral data information records spectral data and related metadata. The table of instrument information records the spectrometer information. The numbers (i.e. 1 and m) represent the number of records in each table, indicating that one record in the table (e.g. code of mineral/rock type) corresponds to multiple records in another table (e.g. code of mineral/rock).
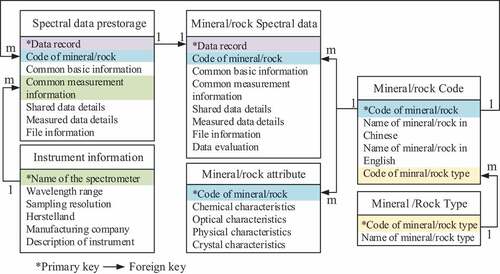
Figure 2. The processing workflow of RockSL. The sequence numbers on the left represents the corresponding data table in the spectral library, which was operated in corresponding steps.
Figure 3. The original image of the spectral curve (left panel) and its corresponding vectorized digital curve (right panel). The original images of muscovite and quartz as examples were downloaded from USGS and MISA spectral libraries, respectively (Kokaly et al., Citation2017; Peng & Liu, Citation1982).
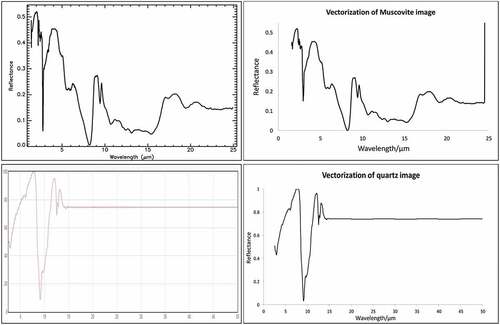
Figure 4. The matching result of quartz sample. (a) The matching module with three reference spectrums (no. 3289, no. 3290 and no. 4440) of quartz sample from PDS Geoscience spectral library and ASU spectral library. (b) Comparison of unknown spectral curve and reference spectral curves of quartz.
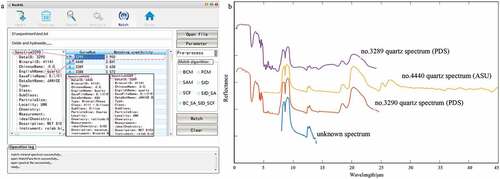
Table 3. Matching results of spectral data of quartz specimen and reference spectra in RockSL.
Figure 5. Visualization examples of a subspace projection in a 3D metadata cube: abstract model of establishing characteristic dataset of RockSL. The article elaborated several datasets of particle size, wavelength range and mineral component.
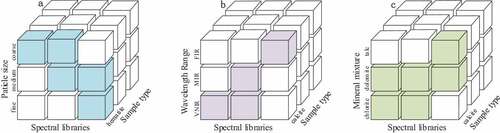
Table 4. The selection of metadata to establish the characteristic dataset.
Figure 6. The reflectance spectra of hematite with different particle sizes. Spectral data from NEU measured in laboratory (Wang et al., Citation2018).
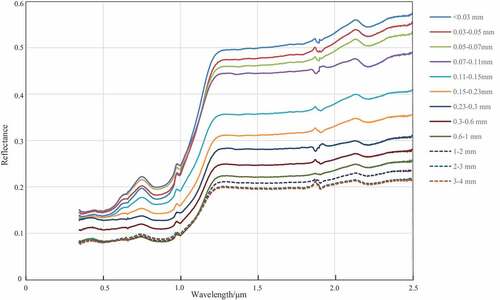
Figure 7. The full-band spectral data of calcite mineral from diverse libraries (i.e. USGS, PDS, JHU, ASU and MISA). The curve (ranges from 1.6–200 µm/6250-50 cm−1) of USGS is displayed on the horizontal axis of wavenumber to highlight the characteristics of the far-infrared bands, while other curves are displayed on the horizontal axis of wavelength.
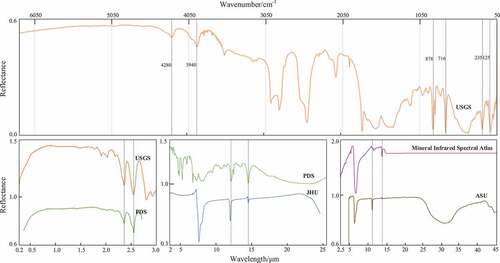
Figure 8. The spectra of calcite mineral with different mixture minerals measured by Analytical spectral devices (ASD) and Beckman instrument (downloaded from USGS Spectral library). Spectra are offset for clarity.
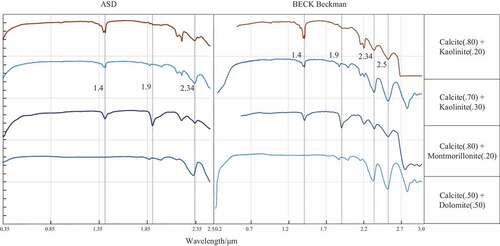
Figure 9. The data check result of hematite samples based on boxplot algorithm.
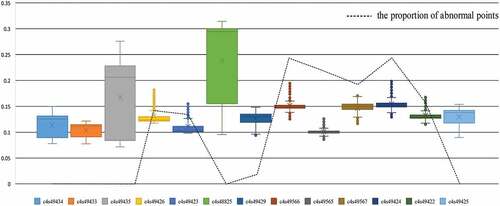
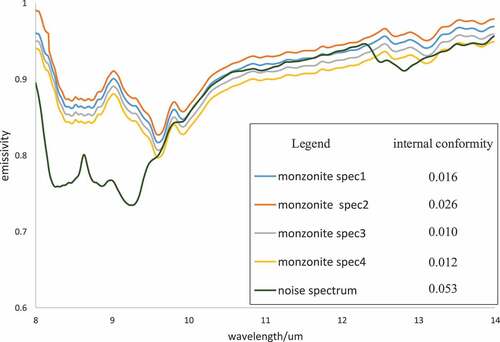
Figure 10. The data check result of multiple curves of monzonite sample based on internal conformity.
Data availability statement
The integrated spectral library (RockSL) described in this article is openly available on GitHub at https://github.com/CSU-PCP-XBS/spectral-dataset-RockSL.