
Figures & data
Figure 1. The study area: the northern Equatorial Africa and Sahel region (shown by Google Earth Image). The Sahel region, defined by precipitation gradient, is shown by the red dashed area.
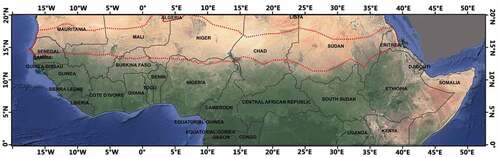
Table 1. Names of DMSP-OLS annual stable imagery product available for the satellite flying years.
Table 2. Specifications of DMSP-OLS VNIR band and the NPP-VIIRS Day/Night band (DNB).
Figure 2. Workflow to generate the harmonized annual nighttime light radiance data for northern Equatorial Africa and Sahel from 1992 to 2020.
Figure 3. DN value time series of three reference pixel examples.
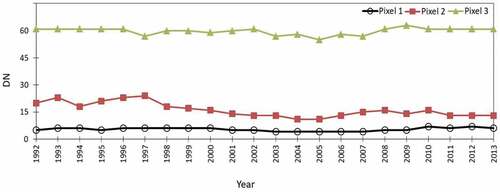
Figure 4. The second-order inter-annual-sensor calibrations (red lines) and scatter plots (black points) of the DN values in each yearly image vs. the DN values in the reference image (DN 2010) for the 7286 reference pixels.
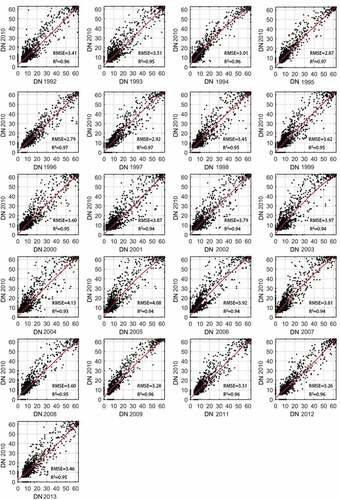
Table 3. Annual values of the ,
and
coefficients of EquationEquation 1
(1)
(1) to calibrate the annual OLS DN values to the reference 2010 DN values.
Figure 5. Inter-annual-sensor calibration of annual OLS data on stable nighttime lights from 1992 to 2013 in the study area: TNDNs time series of the original OLS annual data for each satellite are shown in different colors, and TNDNs time series of the calibrated -OLS annual data are shown by black lines with circles.
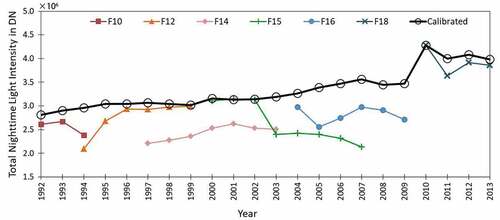
Figure 6. DN time series of pixel example in the original OLS annual data for each satellite are shown in different colors, and DN time series of pixel example in the calibrated -OLS annual data are shown by black lines with circles.
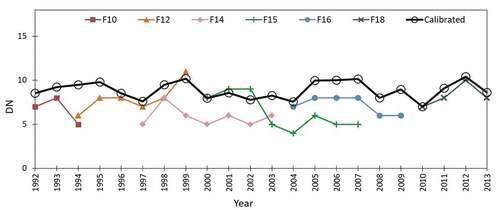
Figure 7. Relationship between 2013 OLS DN and 2103 VIIRS radiance: (a) Median calibration relationship between median VIIRS radiance and OLS DN values; (b) inverse function of Figure 7a; median radiance points (red) and best fit (black line) according to EquationEquation 3(3)
(3) (a, left) and EquationEquation4
(4)
(4) (b, right).
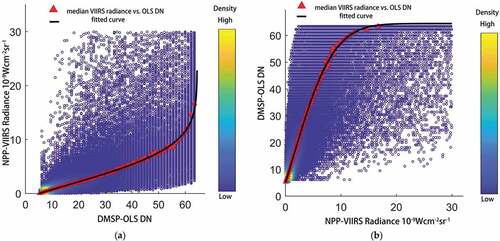
Figure 8. RMSE between the 2013 actual OLS DN data and the 2013 GLF filtered synthetic OLS DN data; optimal window size of 7 × 7 pixels and optimal standard deviation = 1.51 estimated as the values applying to the minimum RMSE; the color bar denotes the RMSE in radiance units because the calibration EquationEquation 3(3)
(3) establishes a 1 to 1 relationship between DN and radiance values.
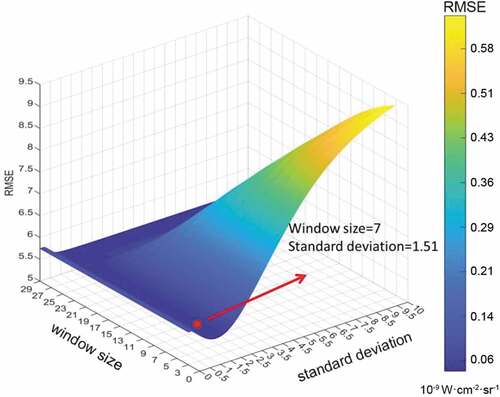
Table 4. The root mean square error (RMSE) and the correlation coefficient between the synthetic OLS DN data and the actual OLS DN data in 2013 before and after applying the Gaussian Low-pass Filter (GLF).
Figure 9. Histograms of the OLS2013 (blue) and the synthetic-OLS2013 (red) radiance data.
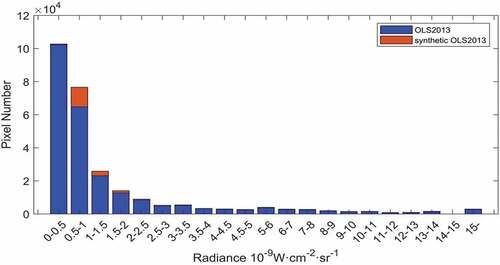
Figure 10. TNLs in 2013 vs. (a) Longitude and (b) Latitude in northern Equatorial Africa and Sahel; OLS2013 (blue line), synthetic-OLS2013 (red line) and VIIRS2013 (green line). (c) and (d) show the low-radiance detail of (a) and (b), respectively.
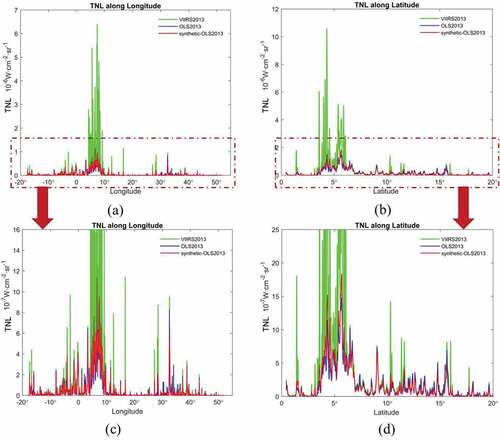
Figure 11. Local profile of the 2013 nighttime light intensity of a sample image segment in Accra, Ghana: (a) synthetic-OLS2013; (b) OLS2013; and (c) VIIRS2013; (d) nighttime light radiances along the transect-pixels in the three images (a, b and c), respectively. The transect is delineated by the yellow box.
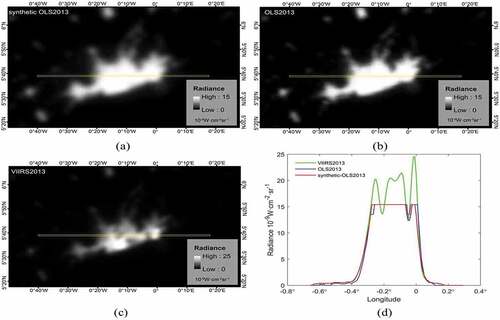
Figure 12. Local profile of the 2013 nighttime light intensity of a sample image segment in Dakar, Senegal: (a) synthetic-OLS2013; (b) OLS2013; and (c) VIIRS2013; (d) nighttime light radiances along the transect-pixels in the three images (a, b and c), respectively. The transect is delineated by the yellow box.
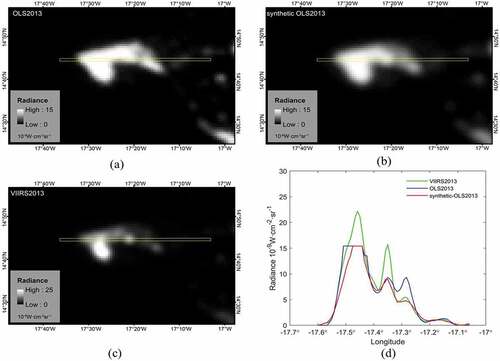
Figure 13. Local profile of the 2013 nighttime light intensity of a sample image segment in the southern coast of Nigeria: (a) synthetic-OLS2013; (b) OLS2013; and (c) VIIRS2013; (d) nighttime light radiances along the transect-pixels in the three images (a, b and c), respectively. The transect is delineated by the yellow box.
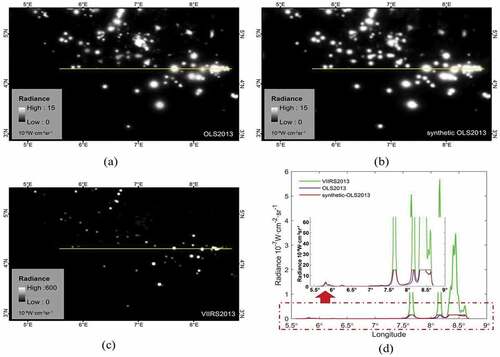
Figure 14. Total radiance of nighttime lights in northern Equatorial Africa and Sahel based on the harmonized time series of OLS radiance data on nighttime lights between 1992–2020.
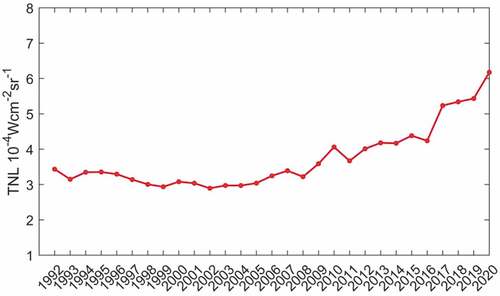
Figure 15. Relationship between 2013 OLS DN and the logarithm of 2103 VIIRS radiance and fitted curve (red line) according to Ma’s method in northern Equatorial Africa and the Sahel.
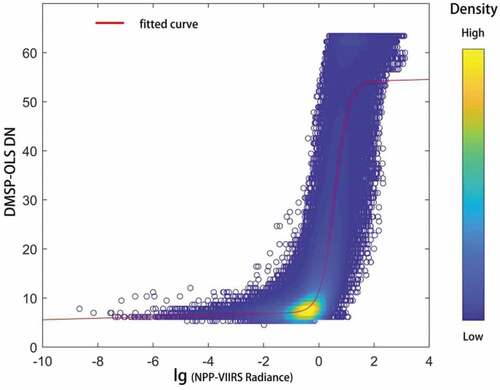
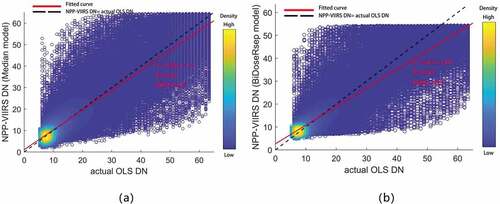
Figure 16. (a): actual OLS DN vs. NPP-VIIRS DN (generated by Median model) in 2013. (b): actual OLS DN vs. NPP-VIIRS DN(generated by BiDoseRsep model)in 2013. The black dotted lines indicate the 1:1 line (i.e. actual OLS DN = NPP-VIIRS DN). The red lines refer to the fitted linear model.
Data Availability Statement
The nighttime light data that support the findings of this study are available from the Earth Observation Group from Colorado School of Mines at https://eogdata.mines.edu/dmsp/downloadV4composites.html and https://eogdata.mines.edu/download_dnb_composites.html.