Figures & data
Figure 1. Spatial distribution of (a) meteorological stations and field snow courses; (b) land use types over China.
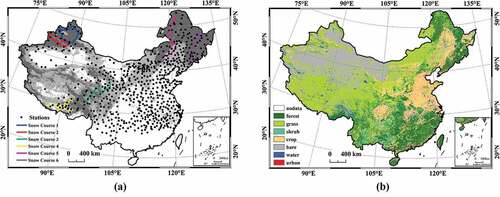
Table 1. The main parameters measured along these four snow survey courses (conducted from December 2017 to May 2019).
Table 2. Summary of the main passive microwave remote sensing sensors. The letter “A” and “D” represent ascending and descending, respectively.
Table 3. The information of the SWE product provided by this paper.
Figure 2. Comparison of SWE estimates and weather station measurements.
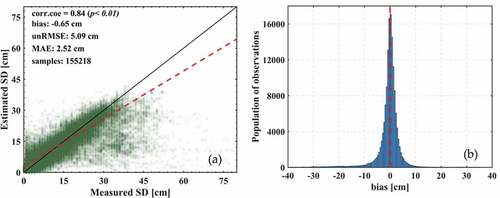
Figure 3. Time series (2011–2019) comparison between measured and estimated snow depth data.
Figure 4. Validation of snow depth product with field snow course data during the period 2018–2019.
Figure 5. Spatial distribution of annual (a) averaged SWE and (b) snow cover days (SCD) during the period 1980–2018.
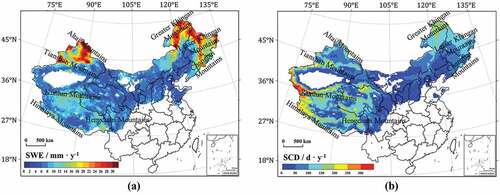
Figure 6. Spatial distribution of annual (a) SWE and (b) SCD trends from 1980 to 2018 based on slope test. Only areas with trends having a significance level exceeding 95% are shown.
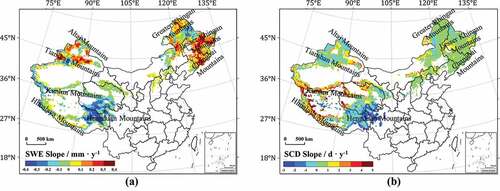
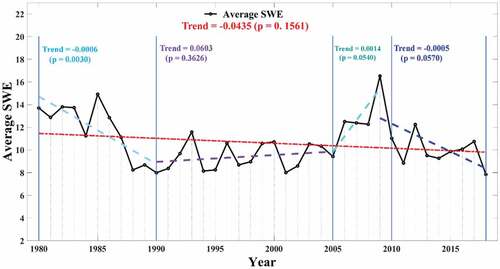
Figure 7. Annual average SWE series of China from 1980 to 2018. Dashed lines represent regression lines of the corresponding SWE series. Trends were considered significant if p < 0.05.