
Figures & data
Figure 1. Spatial distribution of routine surface meteorological stations over the Tibetan Plateau managed by the China Meteorological Administration. Shading denotes the altitude (unit: m). Stations with missing values during 1981–2019 amounting to more than 7.3% are marked in cyan and the others with a percentage below 7.3% are marked in red (altitude above 3000 m) and blue (altitude from 1500 m to 3000 m).
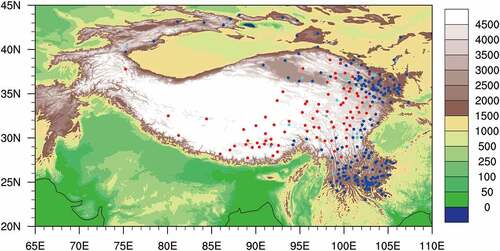
Figure 2. Spatial distribution of the climatological state in 1981–2019 of the annual mean (a) sensible heat flux and (b) latent heat release of condensation (units: W m−2).
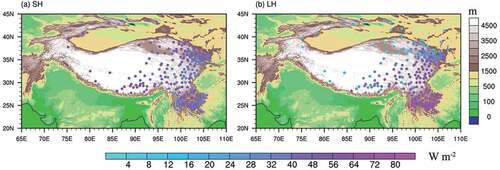
Figure 3. Annual cycle of the multi-station average climatological state in 1981–2019 of sensible heat flux (red) and latent heat release of condensation (blue) (units: W m−2). Solid lines indicate altitude from 1500 m to 3000 m and dashed lines indicate altitude above 3000 m.
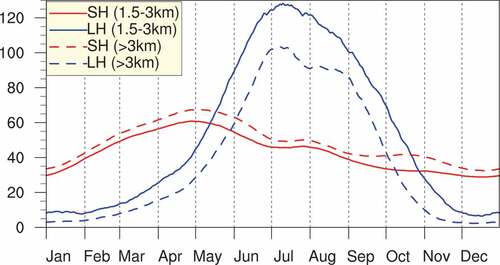
Figure 4. Time series of the station-averaged (a) wind at 10 m (units: m s−1), (b) difference between ground skin temperature and air temperature at 1.5 m (unit: °C), (c) sensible heat flux (units: W m−2), and (d) latent heat release of condensation (units: W m−2). Solid lines indicate altitude from 1500 m to 3000 m and dashed lines indicate altitude above 3000 m.
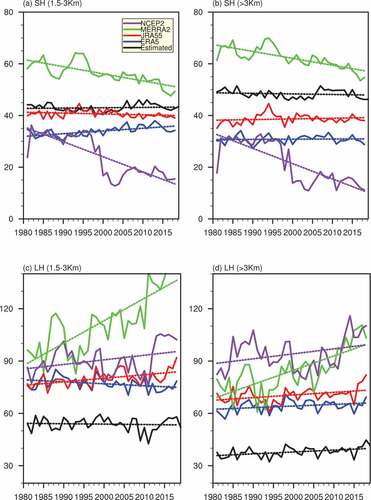
Figure 5. Linear trends and time series of the (a, b) sensible heat flux (units: W m−2), and (c, d) latent heat release of condensation (units: W m−2) averaged over the 189-stations (a, c) and 79-stations (b, d) on the TP from multiple datasets.
Data availability statement
The data described in this article are openly available on LASG data sharing platform (http://data.lasg.ac.cn/TPSHLH/). The data described in this article are openly available in the Open Science Framework at http://data.lasg.ac.cn/TPSHLH/.