
Figures & data
Table 1. Evaluated software packages and DGGS types, selected resolution levels and corresponding maximum number of cells at the highest resolution.
Figure 1. Global map of normalized area and compactness values for H3 DGGS cells.
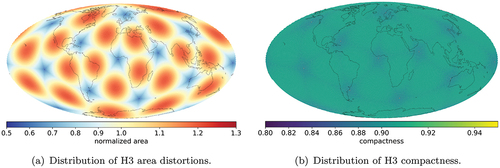
Figure 2. Global map of normalized area and compactness values for S2 DGGS cells.
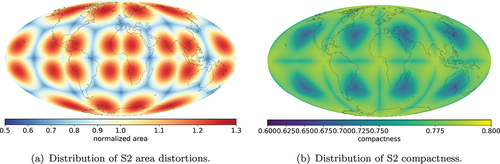
Figure 3. Global map of normalized area and compactness values for OpenEAGGR DGGS cells.
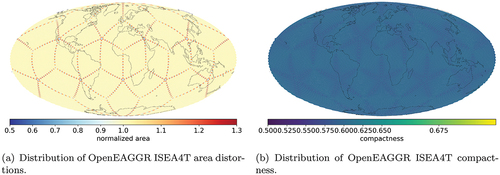
Figure 4. Global map of normalized area and compactness values for rHEALPix cells.
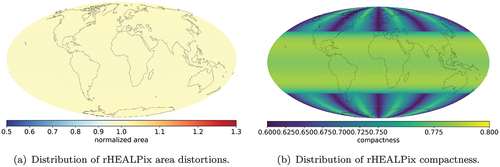
Figure 5. Global map of normalized area and compactness values for DGGRID ISEA7H cells.
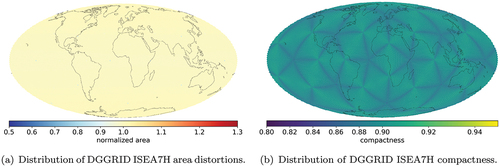
Figure 6. Global map of normalized area and compactness values for DGGRID FULLER7H cells.
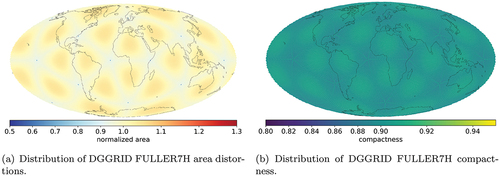
Figure 7. Global map of normalized area and compactness values for DGGRID ISEA4D cells.
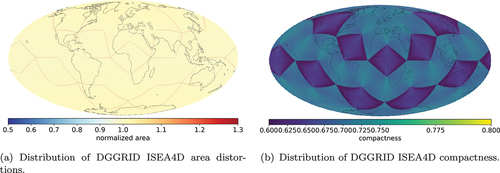
Figure 8. Global map of normalized area and compactness values for DGGRID FULLER4D cells.
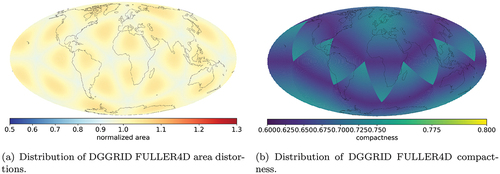
Figure 9. Global map of normalized area and compactness values for DGGRID ISEA4T cells.
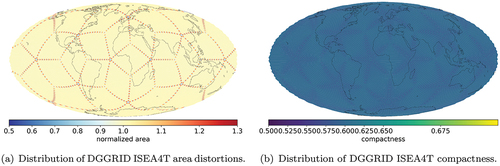
Figure 10. Global map of normalized area and compactness values for DGGRID FULLER4T cells.
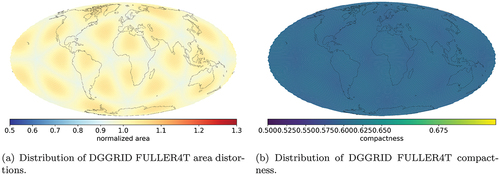
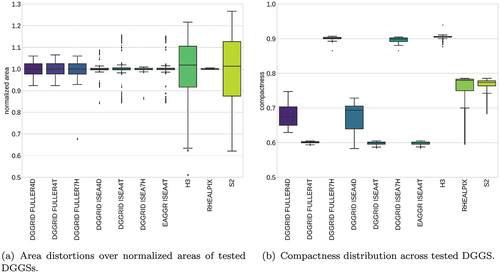
Figure 11. Summary boxplots of normalized area and compactness values for the cells of the tested DGGSs.
Supplemental Material
Download MS Word (629.7 KB)Data availability statement
The data that support the findings of this study are openly available on “Zenodo” at https://doi.org/10.1080/20964471.2022.2094926, reference number 6634479 Version v1.0.2.