
Figures & data
Figure 1. The map shows how the Open Data Cube (ODC) global impact has spread to more than 100 countries, exemplarily illustrating the interest in local EO data cubes. This figure includes countries within regional initiatives (e.g. Digital Earth Africa, Digital Earth Pacific) as well as individual countries that have implemented their own EO data cubes (e.g. Australia, Switzerland, Mexico). In addition, there are known EO data cube implementations within countries (e.g. USA states of Virginia and California) that reflect more localised instances. The operational instances are reflected in YELLOW and those under development or consideration are in RED. Besides the ODC implementations, also implementations based on other technologies exist (see Section 2.2). The extent of the technical implementations of the data cubes and their data availability may go beyond or are only partially within national administrative boundaries.
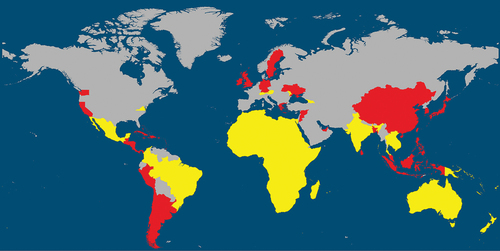
Figure 2. Five different perspectives show the benefits of local EO data cubes.
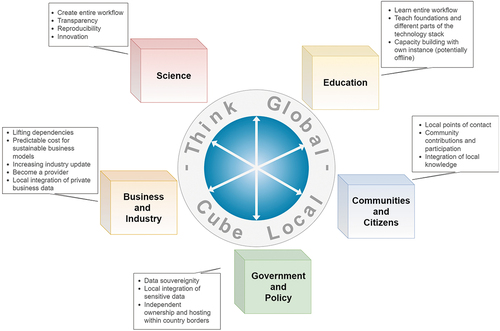
Figure 3. Annual mean Normalized Difference Water Index (NDWI) for 2021 processed by the SDC and visualised through a WMS service into the National Map Viewer of the Swiss Confederation (https://map.geo.admin.ch). NDWI is a proxy for vegetation water content and allows tracking vegetation conditions across the country. .
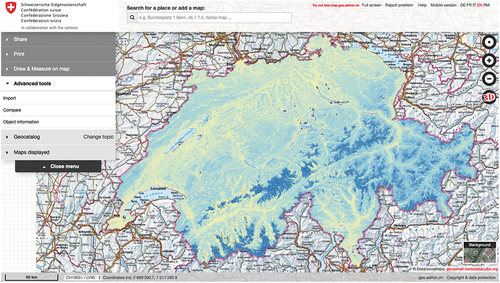
Figure 4. The semantic EO data cube infrastructure is built around a flexible, open-source EO data cube software. A knowledgebase contains semantic models, which are translated by a graphical inference engine into queries against an EO data cube, which contains images as well as semantically enriched information layers. Although it is a local EO data cube and larger EO data cubes exist, it implements its own processing workflows and a graphical approach for querying that would not be possible otherwise.
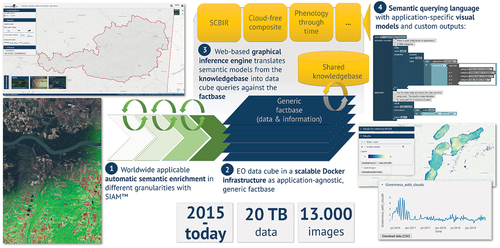
Figure 5. Screen capture of the DE Africa Map showing a comparison of the water detection frequency in 2013 (left panel) and 2021 (right panel) for Lake Ngami, located at the western part of the lower Okavango Delta in Botswana. Water extents are overlaid on a true color Sentinel-2 geomedian image from 2021.
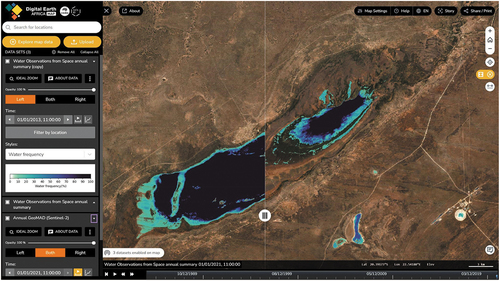
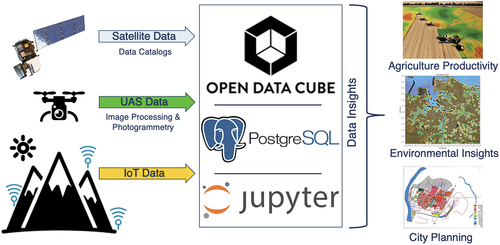
Figure 6. The integration of satellite data, drone data, and internet-of-things data can be accommodated with the Open Data Cube to support many targeted applications. These applications are better addressed with this combination of data in a common framework as opposed to inefficiently using these data in separate workflows.
Data availability statement
Data sharing is not applicable to this article as no new data were created or analyzed in this study.