
Figures & data
Figure 1. The locations of the seven typical glaciers on the Tibetan Plateau that were selected for this study.
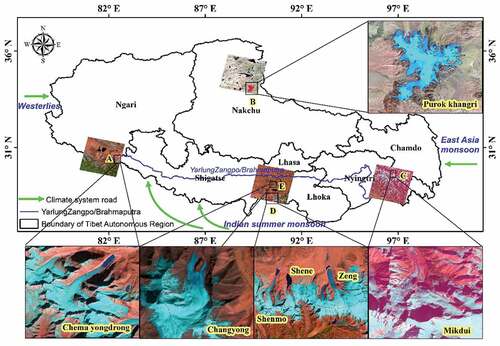
Table 1. Details of the remote sensing data used (data source: http://glovis.usgs.gov/). The relevant satellite sensors are Landsat-2 MSS, Landsat-5 TM, Landsat-7 ETM, and Landsat-8 OLI.
Figure 2. Flowchart showing details of the method used to produce the glacier and proglacial lake dataset.
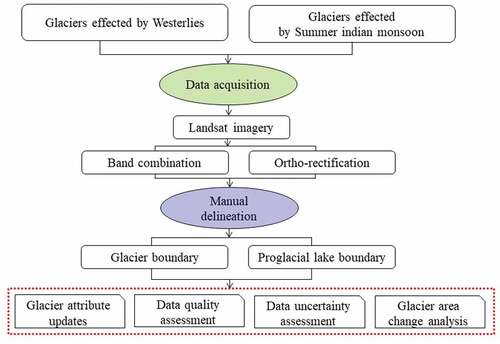
Figure 3. Images showing the boundary of the Chema Yongdrong Glacier terminus: (a) 7-5-4 band combination showing the glacier border, (b) enlarged vector image of the glacier terminus, and (c) enlarged near-infrared image of the glacier terminus.
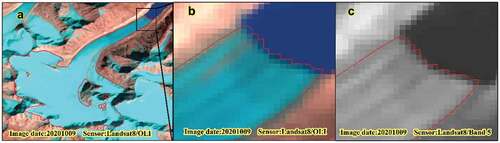
Figure 4. Enlarged view of the fragmented Purok Khangri Glacier: (a) northern and (b) western part (band combination: 7-5-4).
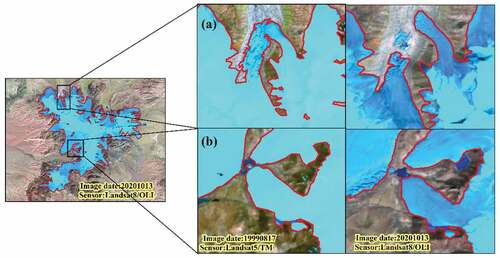
Table 2. Details of the glacier attributes in the dataset.
Figure 5. The size of the relative error in the areas of individual glaciers(a) and proglacial lakes(b).
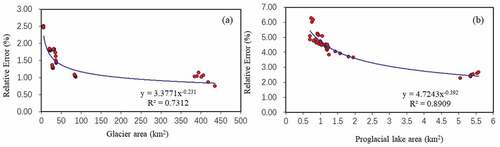
Table 3. Changes in glacier and proglacial lake areas (GA: glacier area, PLA: proglacial lake area; + means glacier/proglacial lake increase, – means glacier/proglacial lake decrease).
Figure 6. Maps showing details of changes in the Purok Khangri Glacier (Areas where notable changes have occurred are circled.) the band combination for (a) is 4-3-2. (The glacier appears white in this image because no Landsat MSS band 5 in 1976 image). The band combination for (b), (c), and (d) is 5-4-3; and the band combination for (e) and (f) is 7-5-4.
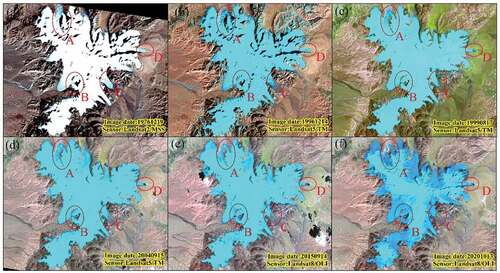
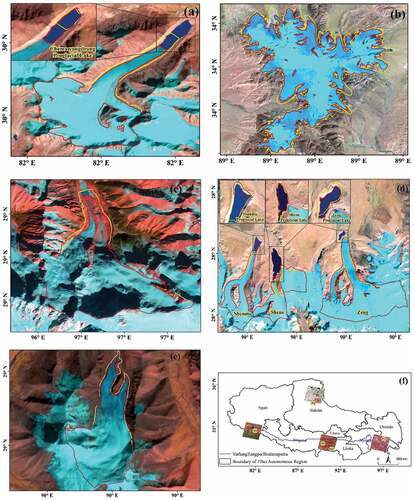
Figure 7. Maps showing changes in the boundaries of seven typical glaciers: (a) Chema Yongdrong Glacier and proglacial lake, (b) Purok Khangri Glacier, (c) Mikdui Glacier, (d) Shene, Shenmo and Zeng glaciers and their proglacial lakes, and (e) Changyong Glacier, the yellow lines mark the 1976 boundaries and the red lines the 2020 boundaries; in parts (c) and (e), the yellow lines mark the 1989 boundaries and the red lines for the 2020 boundaries. (f) shows the distribution of these glaciers.
Data availability statement
The data that support the findings of this study are openly available in http://doi.org/10.57760/sciencedb.j00076.00131.