
Figures & data
Figure 1. Study area (African Sahel-Sudano-Guinean region): (a) land cover map, (b) bioclimatic zone. The land cover information is extracted from the ESA CCI-LC map of 2018. The bioclimatic zone is defined by the Aridity Index (AI) following the classification developed by FAO. The Aridity Index (AI) data is derived as the reciprocal of the aridity index layer extracted from the Global Aridity dataset released by CGIAR Consortium for Spatial Information (CGIAR-CSI). The AI is defined as the ratio of precipitation to reference evapotranspiration.
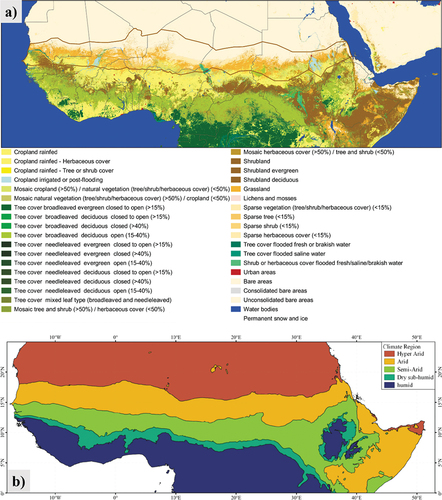
Table 1. Lookup table applied to reclassify land cover types from the ESA CCI land cover products.
Figure 2. Workflow of data pre-processing and analysis.
Figure 3. Flow-chart of the method used to estimate the relative importance of each driver variable.
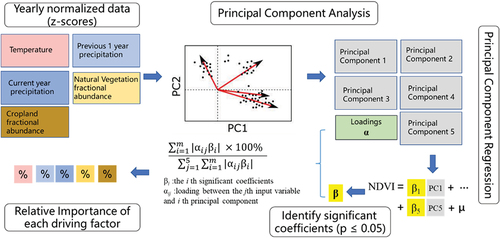
Figure 4. Trends in vegetation greenness in the Sahel-Sudano-Guinean Region: (a) spatial pattern of the significant vegetation greenness trends (Mann–Kendal test, p ≤ 0.05) at 0.05° × 0.05° grid cells; (b) fractional abundance of greening, browning, and no significant trends in the entire region; (c) fractional abundance of greening, browning and no significant trends in each bioclimatic zone. (b) and (c) share the same legend, i.e. green color for “greening”, brown color for “browning”, and grey color for “not-significant”.
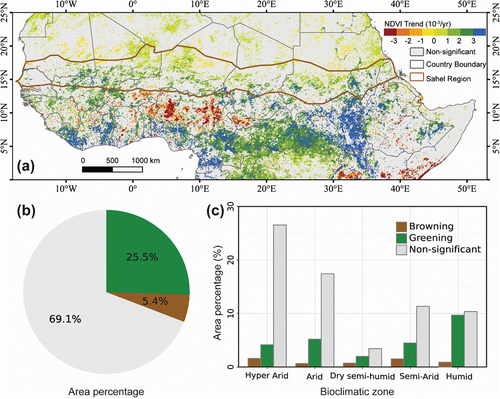
Figure 5. Dominant drivers of the significant vegetation greenness trends in the Sahel-Sudano-Guinean Region: (a) latitudinal profile of the number of the pixels with significant vegetation greenness trends caused by each dominant driving factor; (b) spatial pattern at 0.05° × 0.05° grid cells; (c) longitudinal profile of the number of the pixels with significant vegetation greenness trends caused by each dominant driving factor.
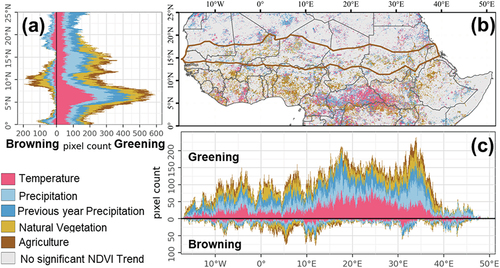
Figure 6. Contributions of underlying driving factors to the significant trends (greening and browning) in each bioclimatic zone (i.e. hyper-arid, arid, semi-arid, dry sub-humid, and humid bioclimatic zone) in the Sahel-Sudano-Guinean Region. The contribution is defined as the fraction of pixels with significant greening trends in a certain bioclimatic zone caused by each dominant driver. The statistics for the areas with a significant browning trend are plotted on the left side of the central red line, while on its right side are the statistics for the areas with a significant greening trend.
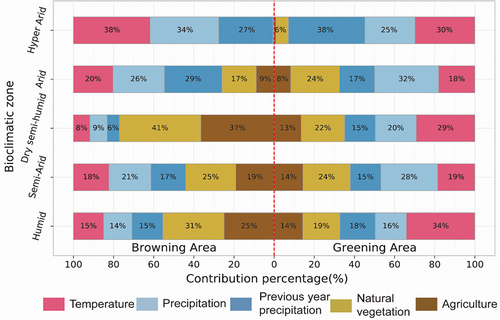
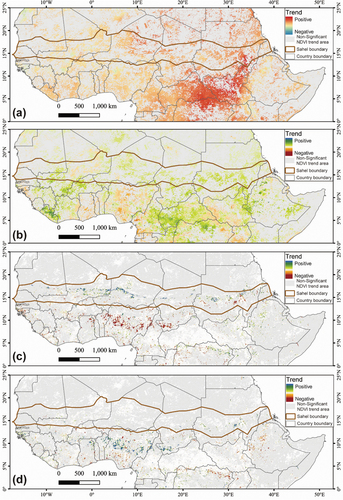
Figure 7. Trends in temperature and precipitation and natural vegetation and agriculture at locations identified by a significant (Mann-Kendall trend test, p ≤ 0.05) on NDVI trends: (a) temperature; (b) precipitation; (c) natural vegetation; (d) agriculture.
Supplemental Material
Download MS Word (788.4 KB)Data availability statement
Data sharing is not applicable to this article as no new data were created or analyzed in this study.