

Figures & data
Figure 1. Distribution of the mean value of temperature (a), precipitation rate (b), and downward shortwave radiation (c) in the China Meteorological Forcing Dataset (CMFD) from 1979 to 2018.
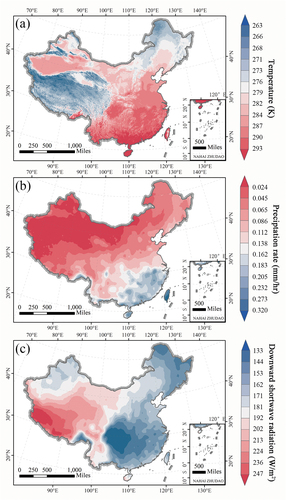
Table 1. Classification of SPI and SPEI.
Figure 2. Spatial distribution of drought severity (DS), duration (DD), and frequency (DF) extracted from the 3-month-scale monthly SPI on Gamma, Gumbel, Logistic, Log-Logistic, and Normal distributions.
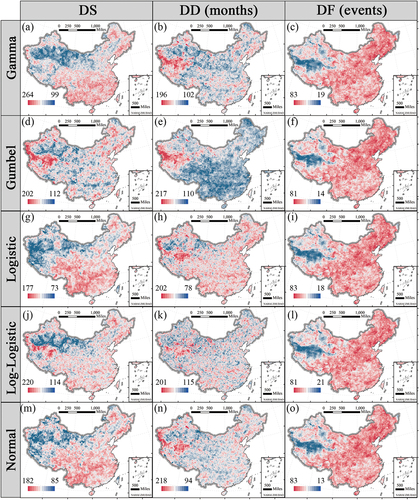
Figure 3. Spatial distribution of drought severity (DS), duration (DD), and frequency (DF) extracted from the 3-month-scale monthly SPEI on GEV, Log-Logistic, Normal, and Pearson Type III distributions.
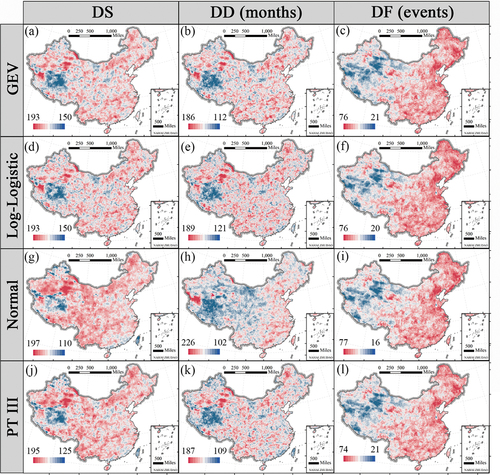
Figure 4. The relationship between the daily and monthly SPI (a) or SPEI (b) time series on 1-month scale. The dashed line perpendicular to the x-axis is the turning point of the time series. The gray (daily SPI or SPEI) and red (monthly SPI or SPEI) text before and after the dashed line are the slope and significance of the time series before and after the turning point.
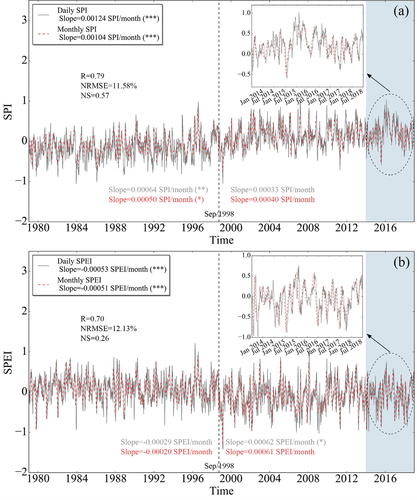
Figure 5. The relationship between the daily and monthly SPI (a) or SPEI (b) time series on 3-month scale. The dashed line perpendicular to the x-axis is the turning point of the time series. The gray (daily SPI or SPEI) and red (monthly SPI or SPEI) text before and after the dashed line are the slope and significance of the time series before and after the turning point.
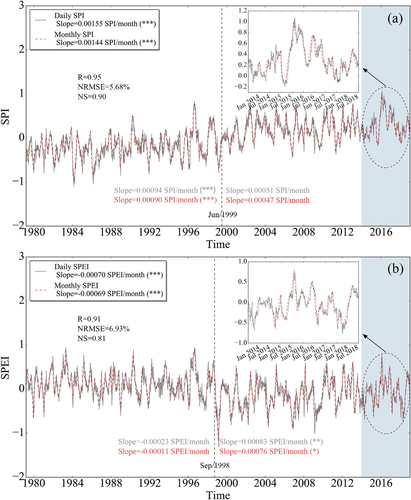
Figure 6. The relationship between the daily and monthly SPI (a) or SPEI (b) time series on 12-month scale. The dashed line perpendicular to the x-axis is the turning point of the time series. The gray (daily SPI or SPEI) and red (monthly SPI or SPEI) text before and after the dashed line are the slope and significance of the time series before and after the turning point.
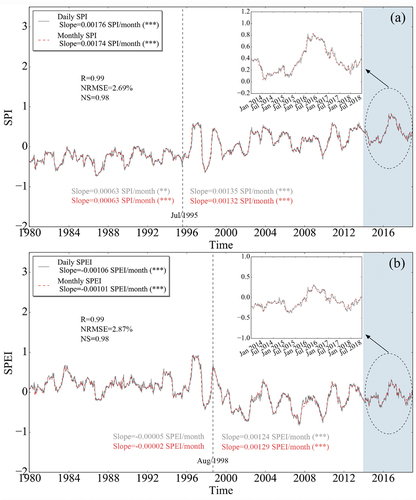
Figure 7. Boxplots of R, NRMSE, NS values between daily and monthly SPI or SPEI time series for each grid point.
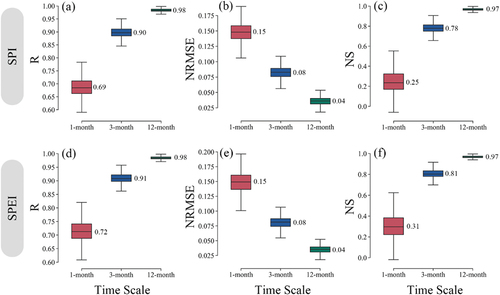
Figure 8. Spatial distribution of drought severity, duration, and frequency extracted from daily and monthly SPI at 12-month scale.
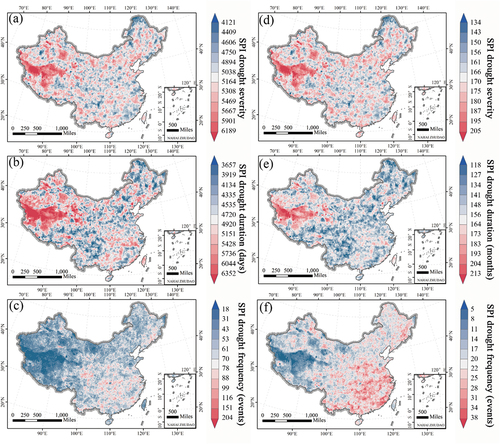
Figure 9. Spatial distribution of drought severity, duration, and frequency extracted from daily and monthly SPEI at 12-month scale.
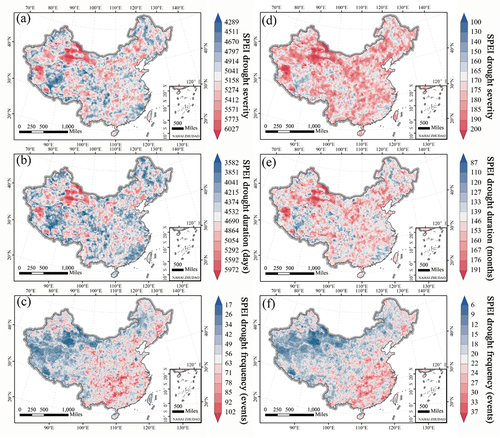
Figure 10. Spatial distribution of trends in drought severity, duration, and frequency extracted from daily and monthly SPI on 12-month scale.
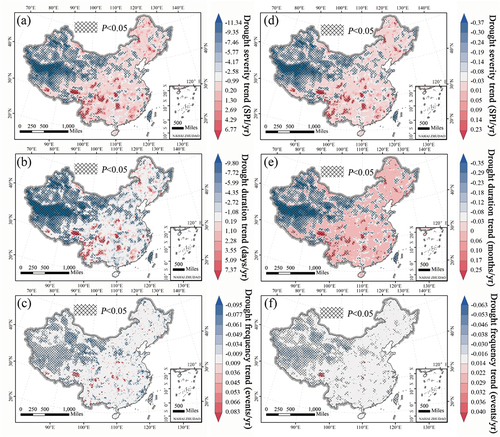
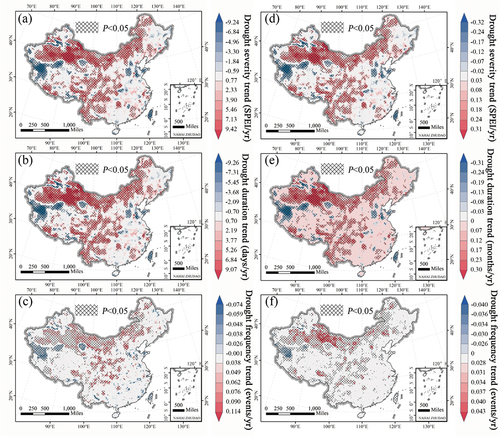
Figure 11. Spatial distribution of trends in drought severity, duration, and frequency extracted from daily and monthly SPEI on 12-month scale.
Data availability statement
The data described in this article are openly available on Figshare (https://doi.org/10.6084/m9.figshare.c.5823533) or on ScienceDB (https://doi.org/10.57760/sciencedb.j00076.00103).