
Figures & data
Table 1. Comparing digital twins’ definitions proposed in various perspectives and scopes.
Figure 1. The flowchart of the research approach and process including paper selection, search string, inclusion and exclusion criteria, and records’ number.
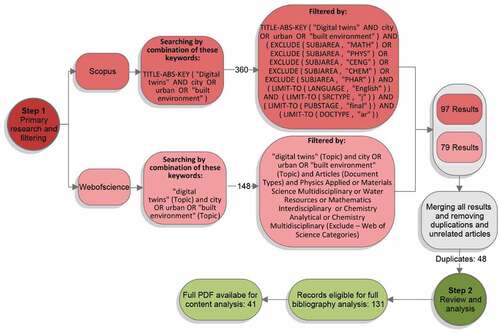
Table 2. Number of publication records obtained based on analysis search strings and keywords in the database.
Table 3. The sum of case studies per year related to the subject of study classified based on countries that the research had been done.
Figure 2. The published scientific literature on City Digital Twins by year until January 2022.
Figure 3. Results of co- authorship network analysis of the 131 documents reviewed related to City Digital Twins.
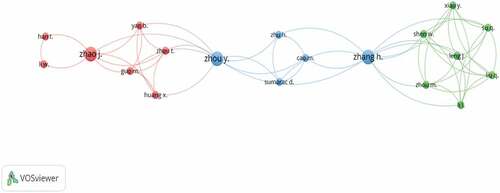
Figure 4. Results of mapping co-occurrence network analysis (plus-keywords) of the terms in the 131 documents reviewed on the City Digital Twins’ studies, identified in the developed bibliography.
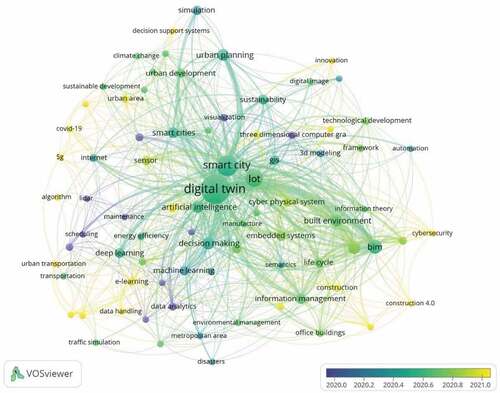
Figure 5. Results of mapping the co-authorship network analysis among countries. The minimum number of co-occurrences of keywords was two.
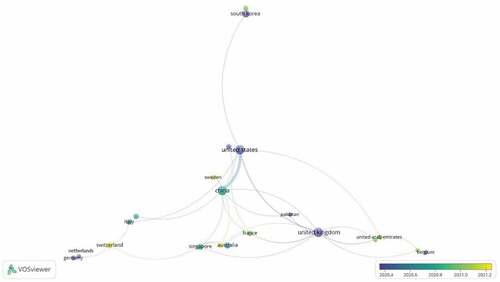
Table 4. The results of classifying data types used in the existing City Digital Twins literature.
Table 5. Distribution of reviewed studies in the subject of research based on data sources used in their research.
Table 6. The results of analyzing case studies mentioned in the existing City Digital Twins literature.
Table 7. Classification of applied technologies in the 41 reviewed City Digital Twins literature.
Figure 6. Distribution of applied methods in 41 reviewed City Digital Twins studies at a glance.
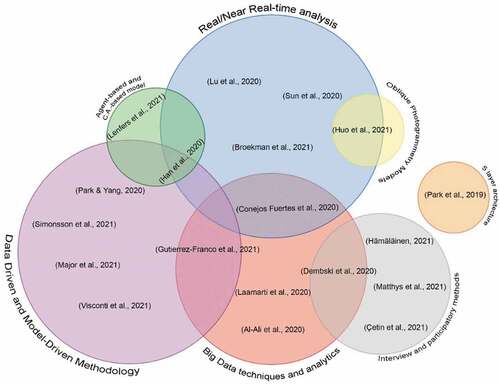
Table 8. Digital twins’ maturity models and classifications that proposed in different sources.
Figure 7. Digital twins maturity levels and descriptions proposed by Evans et al. (Citation2019).
Figure 8. Results of classification of 41 reviewed City Digital Twins studies based on their maturity elements proposed by Evans et al. (Citation2019).
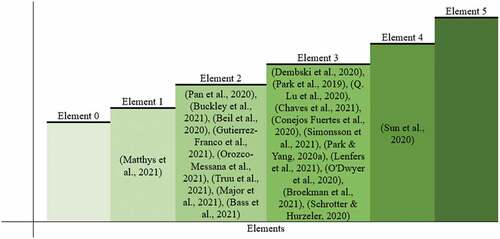
Figure 9. Results of the content analysis on the papers of City Digital Twins. The inner circle shows the main fields of studies in City Digital Twins literature. The next circle illustrates the corresponding sub-fields, and the outer circle reflects the corresponding applications in each subfield. Different colours show separate fields. More frequently explored research areas are reflected with more intense colours and larger sections.
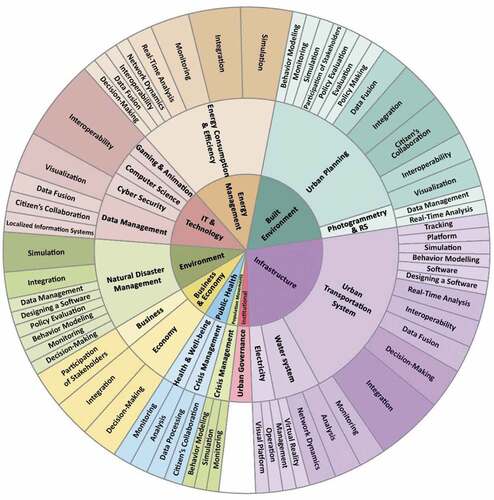
Figure 10. Current state, challenges, and limitations of City Digital Twins.
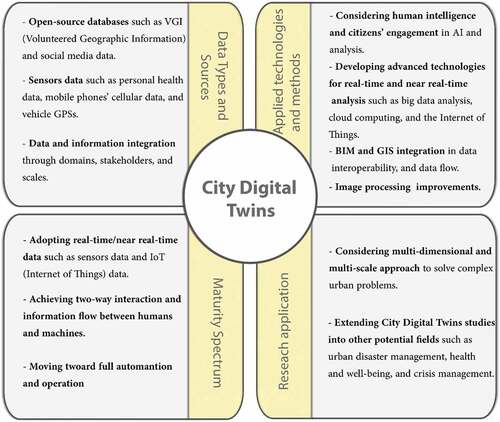
Table 1S. A detailed content analysis of 41 reviewed studies on the subject of research.
Supplemental Material
Download MS Word (68.8 KB)Data availability statement
Derived data supporting the findings of this study are available from the corresponding author [Sara Shirowzhan] on request.