
Figures & data
Figure 1. Taylor diagram for the annual mean (a) Tmax, (b) Tmin, (c) Tmp, (d) DTR and (e) Pre over the major BRI regions between the four-member MME mean and CRU observations for the historical period of 1986–2005.The four-member MME mean is calculated from four-member downscaled CMIP5-GCMs.
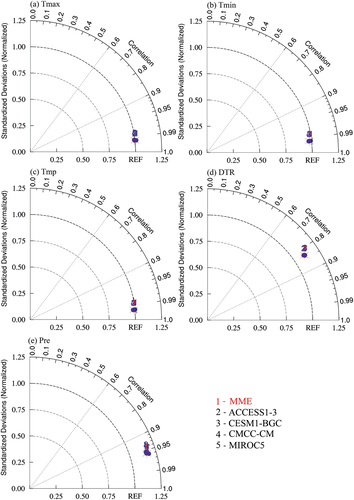
Table 1. The Spatial correlation coefficient, root mean square error (RMSE) and mean absolute error (MAE) for the annual mean daily maximum temperature (Tmax), daily minimum temperature (Tmin), daily average temperature (Tmp), diurnal temperature range (DTR) and Precipitation (Pre) over the major BRI regions between the four-member MME mean and CRU observations for the historical period of 1986–2005 (units: °C for Tmax, Tmin, Tmp and DTR, and mm/d for Pre).
Figure 2. Spatial distribution of Tmax (1st row), Tmin (2nd row), Tmp (3rd row), DTR (4th row) and Pre (5th row) averaged over 1986–2005 for the CRU observations and four-memble MME mean simulations and their differences (MME minus CRU) over the major BRI regions. The units in (a)–(l) and (m)–(o) are °C and mm/d, respectively. The four-member MME mean is calculated from four-member downscaled CMIP5-GCMs. The slash areas are significant at the 95% confidence level.
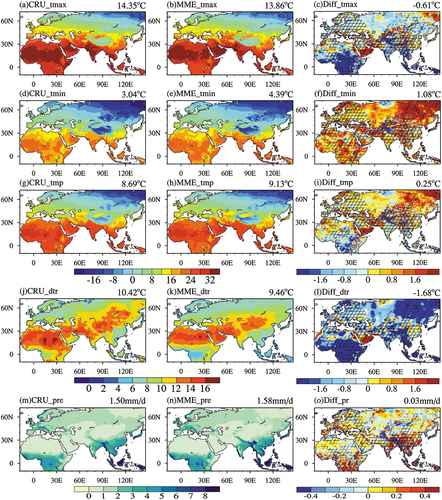
Figure 3. Box-plot diagram for the annual mean (a) Tmax, (b) Tmin, (c) Tmp, (d) DTR and (e) Pre over the major BRI regions, Indian Peninsula (6°N–35°N, 61°E–97°E), Central Asia (35°N–55°N, 50°E–80°E), West Asia (12°N–32°N, 26°E–61°E) and Mediterranean (32°N–52°N, −10°W–50°E) between the four-member MME mean and CRU observations for the historical period of 1986–2005. The four-member MME mean is calculated from four-member downscaled CMIP5-GCMs. The Box-plot diagram from top to bottom is that the upper edge is the maximum value of the variables studied in this paper, the upper edge of the rectangular box is the upper quartile (25% quantile), the horizontal bar inside the rectangular box is the median line, the lower edge of the rectangular box is the lower quartile (75% quantile), and the lower edge is the minimum value of the variables studied in this paper.
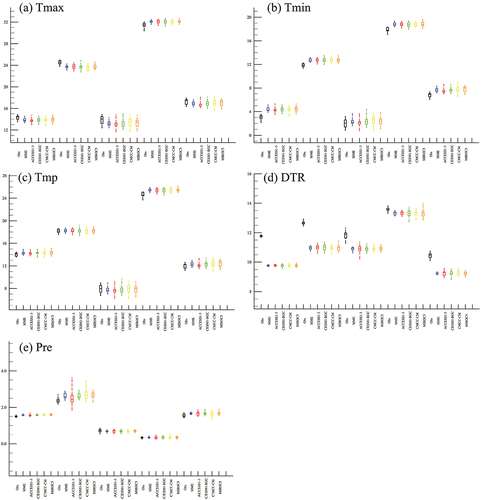
Figure 4. Time series of (a) the original and (b) 11–year moving global mean annual temperature changes for four downscaled CMIP5-GCMs models and their MME mean under the RCP8.5 emission scenario relative to the pre-industrial period 1850–1900. The horizontal dashed lines represent 1.5°C, 2°C and 3°C, respectively.
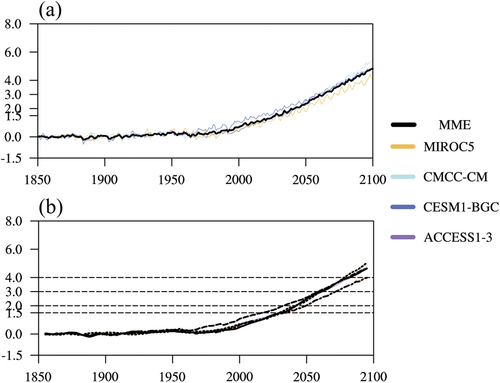
Table 2. The years of 1.5°C, 2°C and 3°C temperature rise targets for individual downscaled CMIP5-GCMs under the RCP8.5 emission scenario.
Figure 5. Spatial distribution of four-member MME mean Tmax for (a) the pre-industrial period (1850–1900); (b) the historical period (1986–2005); at global temperature rise targets of (c) 1.5°C, (e) 2°C and (g) 3°C under the RCP8.5 emission scenario and (d, f, h) their differences relative to the historical period over the major BRI regions (Units: ℃). The slash areas are significant at the 95% confidence level.
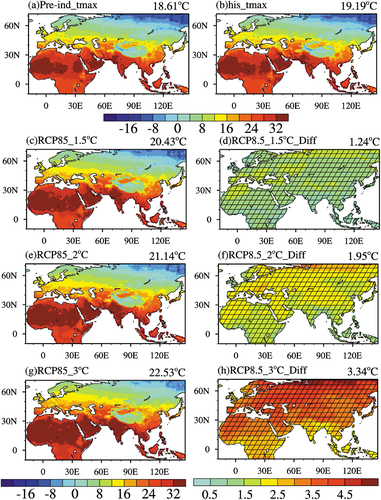
Figure 6. Spatial distribution of four-member MME mean Tmin for (a) the pre-industrial period (1850–1900); (b) the historical period (1986–2005); at global temperature rise targets of (c) 1.5°C, (e) 2°C and (g) 3°C under the RCP8.5 emission scenario and (d, f, h) their differences relative to the historical period over the major BRI regions (Units: °C). The slash areas are significant at the 95% confidence level.
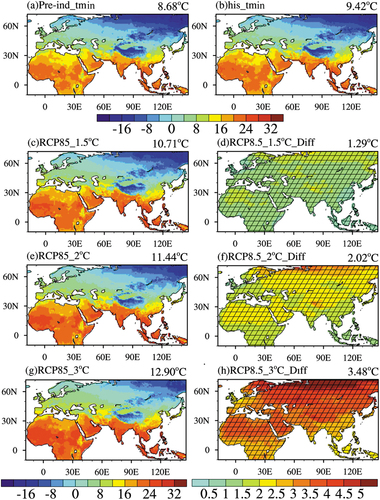
Figure 7. Spatial distribution of four-member MME mean Tmp for (a) the pre-industrial period (1850–1900) and (b) the historical period (1986–2005) at global temperature rise targets of (c) 1.5°C, (e) 2°C and (g) 3°C under the RCP8.5 emission scenario and (d, f, h) their differences relative to the historical period over the major BRI regions (Units: °C). The slash areas are significant at the 95% confidence level.
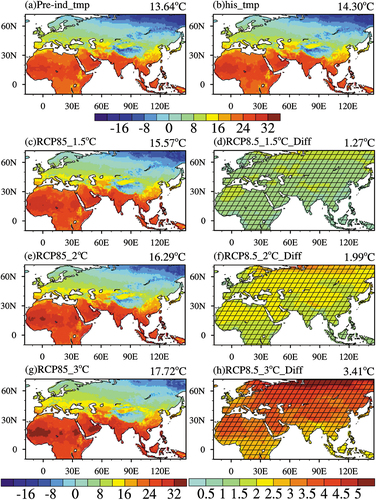
Figure 8. Spatial distribution of four-member MME mean DTR for (a) the pre-industrial period (1850–1900) and (b) the historical period (1986–2005) at global temperature rise targets of (c) 1.5°C, (e) 2°C and (g) 3°C under the RCP8.5 emission scenario and (d, f, h) their differences relative to the historical period over the major BRI regions (Units: °C).The slash areas are significant at the 95% confidence level.
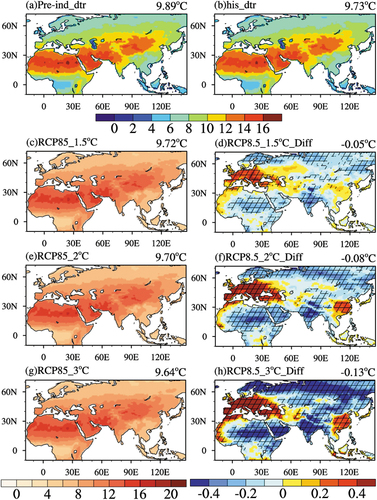
Figure 9. Spatial distribution of four-member MME mean Pre for (a) the pre-industrial period (1850–1900) and (b) the historical period (1986–2005) at global temperature rise targets of (c) 1.5°C, (e) 2°C and (g) 3°C under the RCP8.5 emission scenario and (d, f, h) their differences relative to the historical period over the major BRI regions (Units: mm/d).The slash areas are significant at the 95% confidence level.
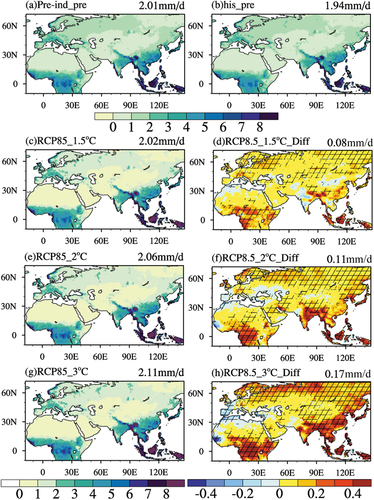
Figure 10. Spatial distribution of Tmp (1st column) and Pre (2nd column) for (a, e) the historical period (1986–2005); at global temperature rise targets of (b, f) 1.5°C, (c, g) 2°C and (d, h) 3°C under the RCP8.5 emission scenario over the Pamir Plateau regions (34°N–45°N, 73°E–80°E). The units in (a)–(d) and (e)–(h) are °C and mm/d, respectively. The four–member MME mean is calculated from four-member downscaled CMIP5-GCMs.
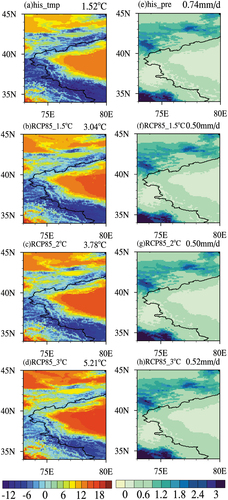
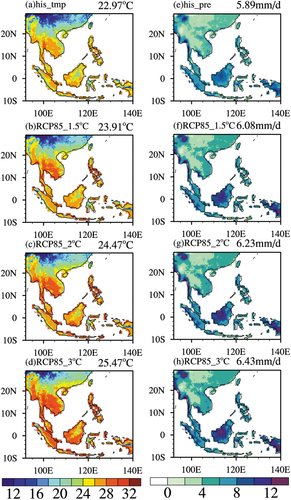
Figure 11. Spatial distribution of Tmp (1st column) and Pre (2nd column) for (a, e) the historical period (1986–2005); at global temperature rise targets of (b, f) 1.5°C, (c, g) 2°C and (d, h) 3°C under the RCP8.5 emission scenario over the Southeast Asia regions (10°S–29°N, 92°E–140°E). The units in (a)–(d) and (e)–(h) are °C and mm/d, respectively. The four-member MME mean is calculated from four-member downscaled CMIP5-GCMs.
Data availability statement
The dataset is openly available at https://doi.org/10.57760/sciencedb.01850 in Science Data Bank in NetCDF format.