
Figures & data
Figure 1. The flowchart of Colombian Solar Atlas.
Table 1. Comparison between other atlases and the Colombian Solar Atlas.
Figure 2. The flowchart of the NREL Physical Solar Model (PSM).
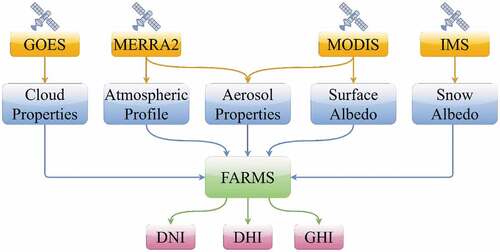
Figure 3. IDEAM in-situ stations spatially located along the Colombian territory collecting data for (a) GHI, (b) temperature and (c) wind speed variables.
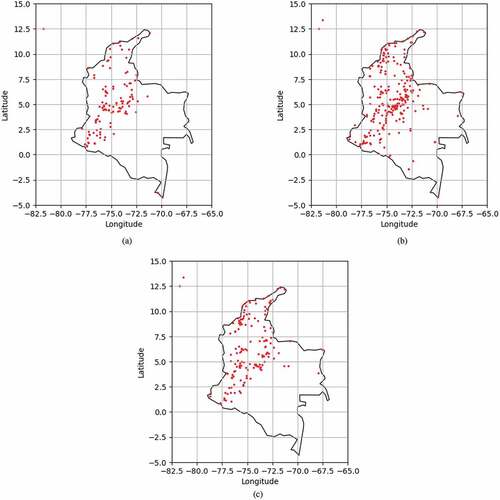
Figure 4. Satellite (x-axis) vs. in-situ (y-axis) averages for GHI (a)(b), temperature (c)(d), and (e)(f) wind speed variables before (left column) and after (right column) bias correction from the period between 1998–2019. Red and green lines represent the 10% and 20% of difference, respectively.
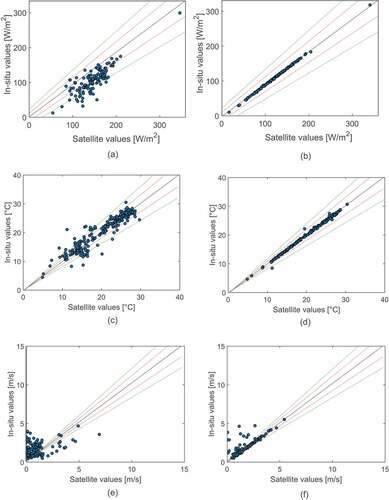
Table 2. Results of the satellite data validation with IDEAM in-situ data before bias correction.
Table 3. Results of the satellite data validation with IDEAM in-situ data after bias correction.
Figure 5. Available maps (from left to right and top to bottom): GHI, DHI, DNI, wind Speed, and temperature.
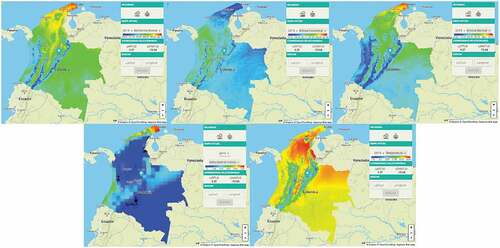
Figure 6. General view of the map with historical data.
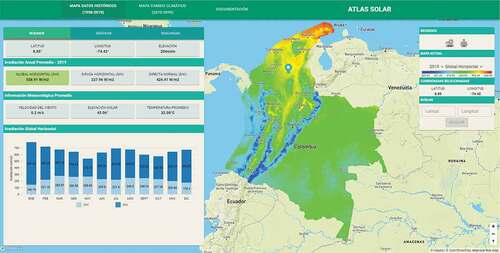
Figure 7. Monthly Averages plot.
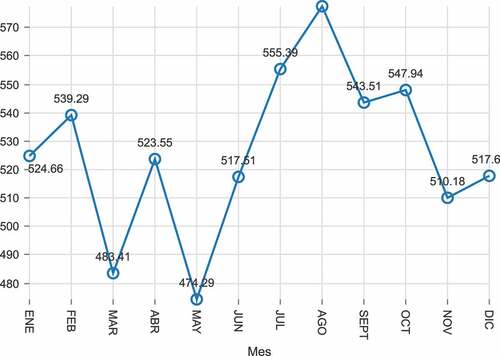
Figure 8. Hourly Averages plot.
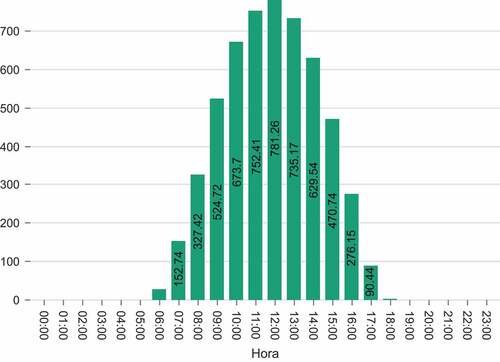
Figure 9. Historical Yearly Averages plot.
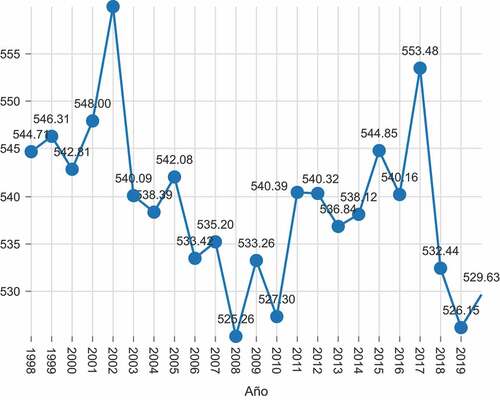
Figure 10. Historical Monthly Averages plot.
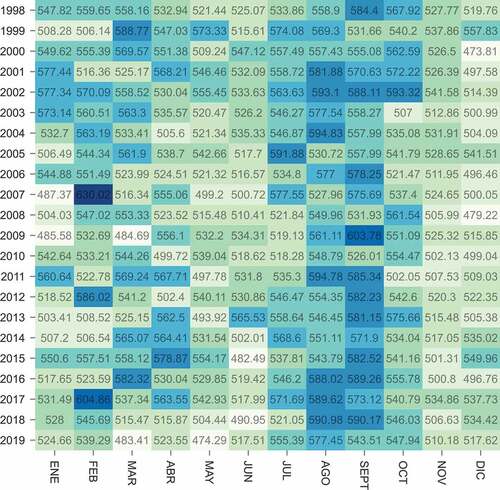
Figure 11. Historical Hourly Average plot.
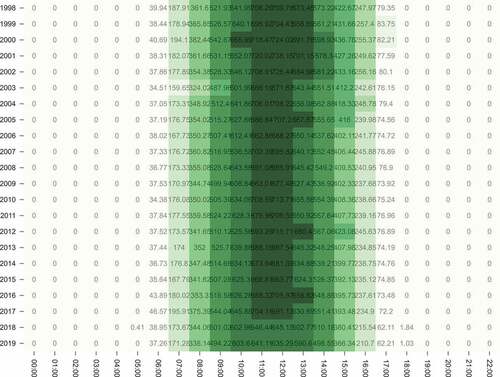
Table 4. An overview of the analyzed CORDEX-CORE experiments. Each experiment has one historical and two scenarios (RCP2.6 and RCP8.5), spanning the periods 1970–2005 and 2070–2099, respectively. The horizontal resolution of all simulations is 0.2° in both latitude and longitude.
Figure 12. Available maps (from left to right): solar irradiance, temperature, and wind speed.
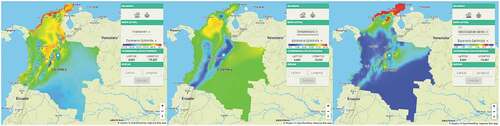
Figure 13. General view of map with estimated data.
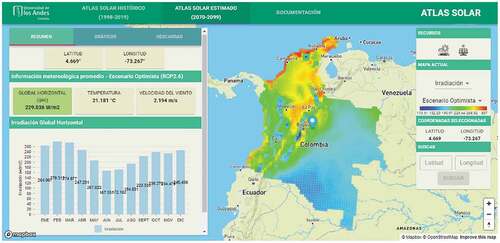
Figure 14. Monthly behavior graph.
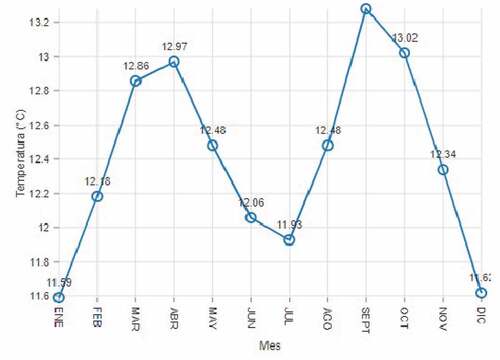
Figure 15. Daily behavior graph.
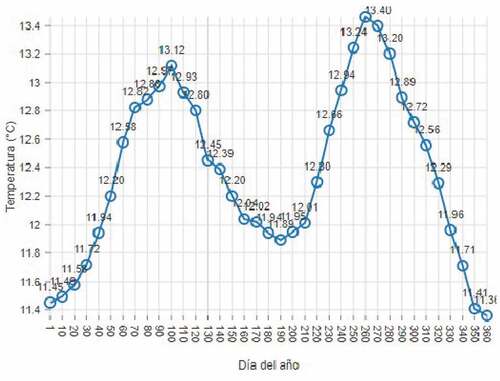
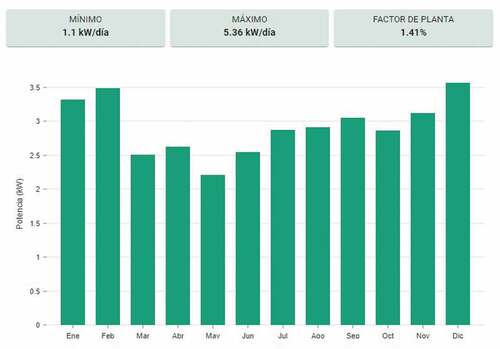
Figure 16. Average power generation graph.
Supplemental Material
Download MS Word (10.3 MB)Data availability statement
The data that support the findings of this study are available in the National Solar Radiation Database (NSRDB) at https://developer.nrel.gov/docs/solar/nsrdb/NSRDB, the Coordinated Regional Climate Downscaling Experiment – Coordinated Output for Regional Evaluations (CORDEX-CORE) at https://cordex.org/data-access/how-to-access-the-data/CORDEX-CORE, and the Institute of Hydrology, Meteorology and Environmental Studies (IDEAM) at http://dhime.ideam.gov.co/atencionciudadano/IDEAM.