
Figures & data
Figure 1. Location of study regions and counties in Kazakhstan and Mongolia. Each number on the map refers to unique counties. County names are provided in Table A1.
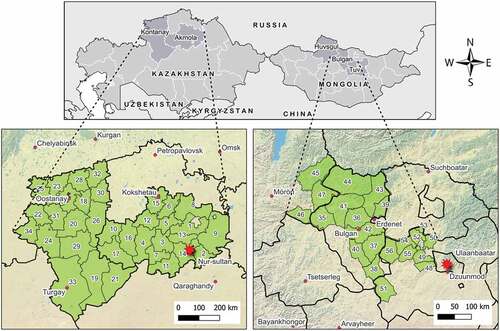
Figure 2. The cropping calendar of spring wheat in Kazakhstan and Mongolia. Source: Authors’ presentation based on data adapted from the FAO (Citation2021, Citation2020) and Shamanin et al. (Citation2016).
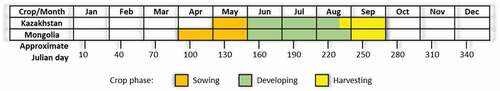
Figure 3. Procedure of relevant data processing and climate data downscaling.
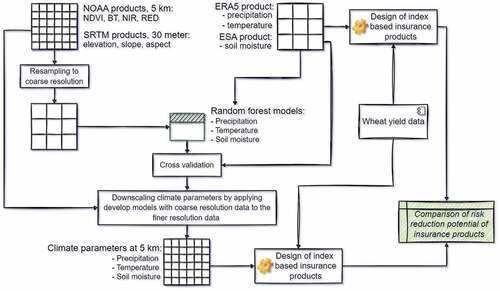
Figure 4. Original coarse resolution, random forest based estimated and downscaled climate parameters, Northern Mongolia in June 2015.
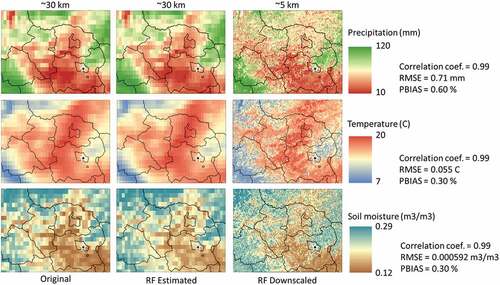
Figure 5. Dynamics of the spearman correlation coefficient between spring wheat yield and monthly scale ERA5-based precipitation and temperature, and ESA-based soil moisture. Counties in (a) Kazakhstan and (b) Mongolia.
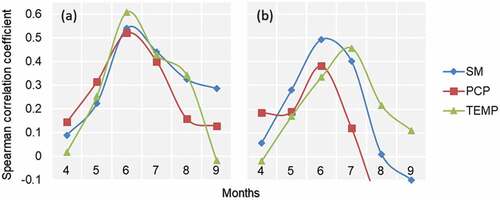
Table 1. Mean hedging effectiveness of index insurance products based on original coarse resolution and downscaled climate data.
Figure 6. Change of hedging effectiveness of index insurances after using downscaled climate data, counties in (a) Kazakhstan and (b) Mongolia. Numbers represent the number of counties.
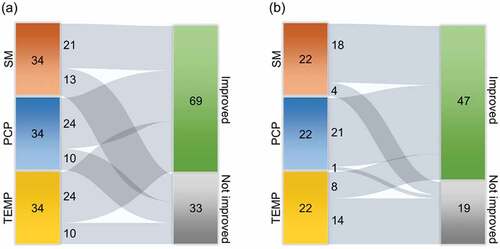
Figure 7. Boxplot and Wilcoxon test results for the hedging effectiveness of index insurance design based on original coarse resolution and downscaled climate data, counties in (a) Kazakhstan and (b) Mongolia. Note: Statistical significance is indicated by the following p-values: *, **
, ***
.
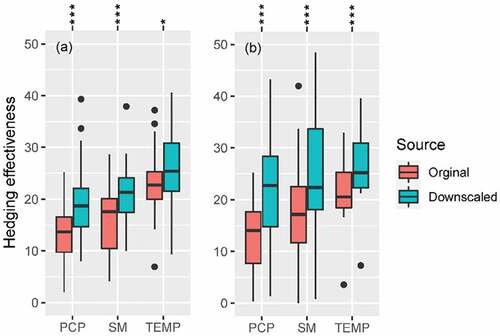
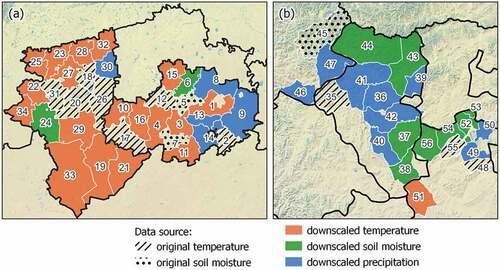
Figure 8. The best index insurance for each county according to hedging effectiveness, counties in (a) Kazakhstan and (b) Mongolia.
Supplemental Material
Download MS Word (2.9 MB)Data availability statement
The data that support the findings of this study are available from the corresponding author, upon reasonable request. https://authorservices.taylorandfrancis.com/data-sharing/share-your-data/data-availability-statements/