
Figures & data
Figure 1. The geographical situation of Qinghai Province.
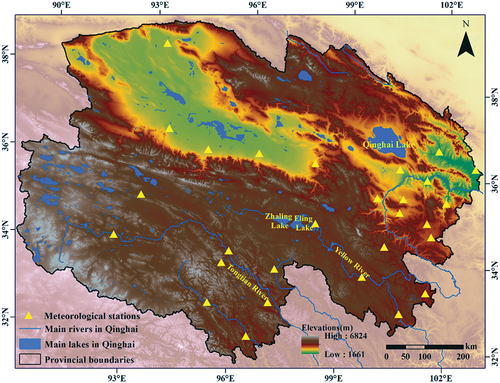
Figure 2. Six basin zones in Qinghai Province, including the Hexi, Qaidam, Yellow, Yangtze, and Inner basin.
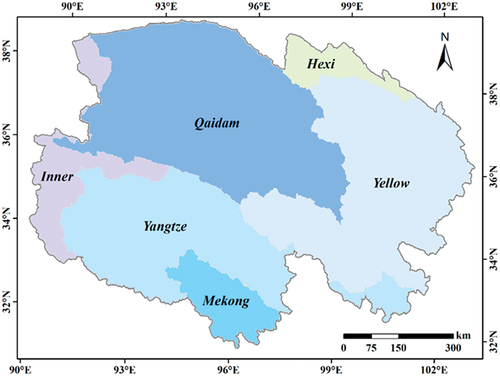
Figure 3. The distribution of the sampling points.
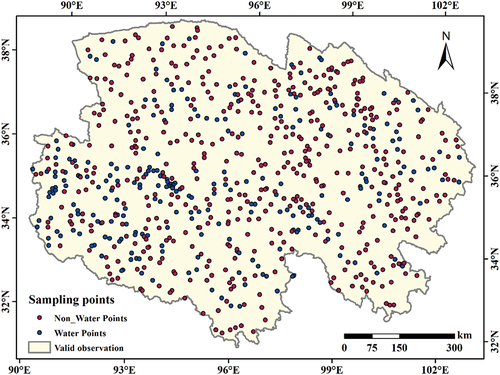
Table 1. The confusion matrix and accuracy assessment result for the extracted surface water map of Qinghai Province in 2018 based on the Google Earth Pro high-resolution image.
Figure 4. Surface water maps of 1986 (a) and 2018 (b).
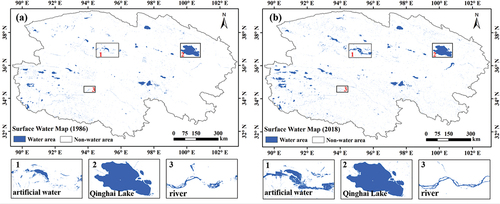
Figure 5. Surface water change from 1986 to 2018 in Qinghai Province. (a) Spatial distribution of surface water change; (b) the inter-annual variations of surface water area; and (c) the Mk test result.
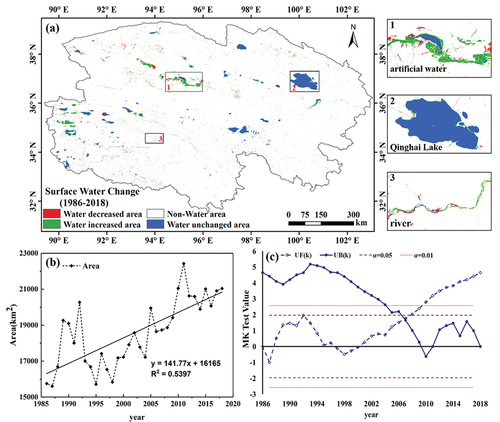
Figure 6. The inter-annual variations of climate factors from 1986 to 2018 in Qinghai Province. (a) Air temperature (T). (b) Precipitation (P). (c) Potential evapotranspiration (ET0).
Table 2. The correlation between surface water and climate factors in Qinghai Province and 3 river basins.
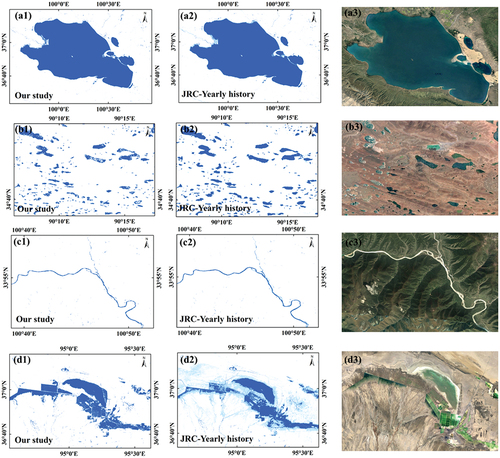
Figure 7. A comparison among the surface water exacted in this study, the JRC yearly history data, and remote sensing images of four different type of water bodies. (a1–a3) Typical lake. (b1–b3) Lake groups. (c1–c3) River. (d1–d3) Artificial water bodies.
Data availability statement
The yearly surface water in Qinghai Province from 1986 to 2018 can be downloaded from https://doi.org/10.5281/zenodo.7532934.