Figures & data
Figure 3. The general schema of the proposed integrated approach.
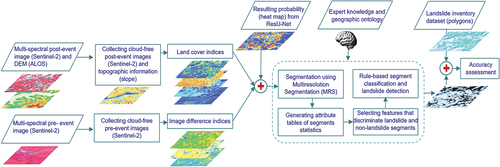
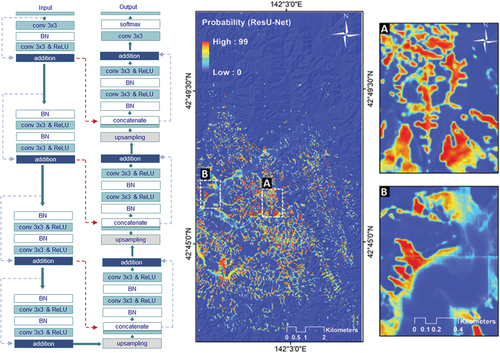
Figure 5. Left, the architecture of the applied ResU-Net in this study. Right, the resulting landslide probability map from the applied ResU-Net. Pixel values closer to 1 represent a higher probability of the landslide class (A and B refer to two enlarged areas).