
Figures & data
Figure 1. MODIS land cover map over the study area. In total, the 0–10 cm depth SM observations of 31 TAHMO stations, 1 COSMOS station, and 1 SD_DEM station are used in this study to validate the proposed method.
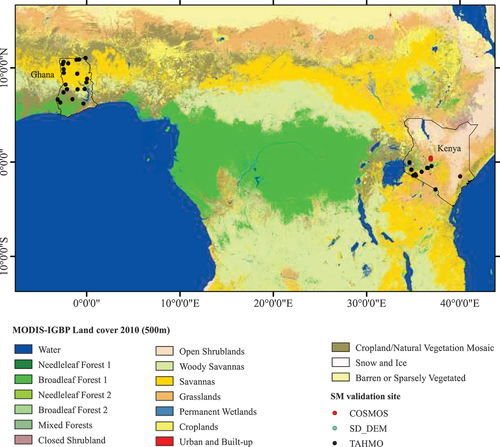
Table 1. The primary attributes of the SM sites which were used in the validation process.
Table 2. Main characteristics of the RS observations and products used in the downscaling methods.
Figure 2. The workflow of the proposed method for estimating SM using GEE.
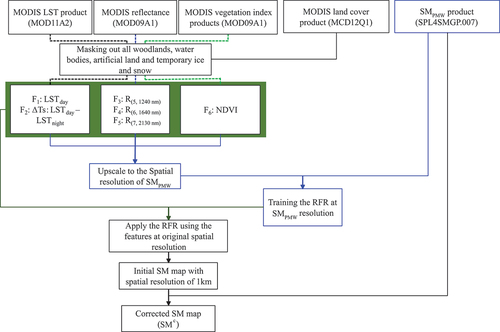
Figure 3. (a) SMAP SM product (SPL4SMGP.007) at 9 km resolution, (b) (LSTdayLSTnight) calculated using MODIS LST products with 1 km spatial resolution, (c) estimated SM map at 1 km spatial resolution using the proposed RFR method, optical/thermal features, and SM values of SMAP, and (d) 1-km SMC map after applying the pixel correction equation on the estimated SM for Kenya, Africa.
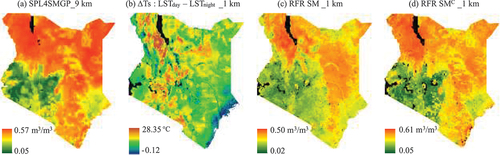
Figure 4. (a) SMAP SM product (SPL4SMGP.007) at 9 km resolution, (b) (LSTday-LSTnight) calculated using MODIS LST products with 1 km spatial resolution, (c) estimated SM map at 1 km spatial resolution using the proposed RFR method, optical/thermal features, and SM values of SMAP, and (d) 1-km SMC map after applying the pixel correction equation on the estimated SM for Ghana, Africa.
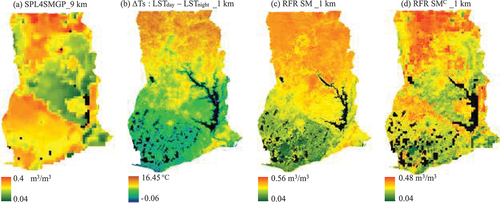
Figure 5. Spatial correlation analyses conducted between the RS-derived SM and in-situ SM measurements, separately for Kenya and Ghana. (a) and (d): SPL4SMGP.007at 9 km spatial resolution, (b) and (e): estimated SM at 1 km before applying pixel-mean correction (EquationEq (3(3)
(3) )), and (c) and (f): SMC at 1 km after applying pixel-mean correction (EquationEq (3
(3)
(3) )).
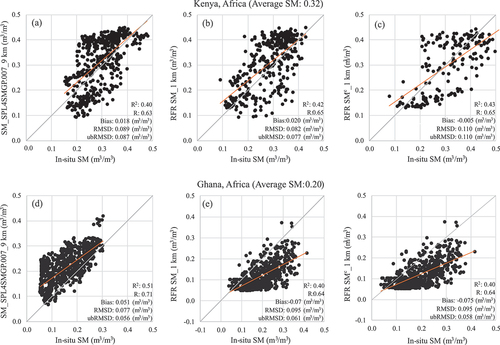
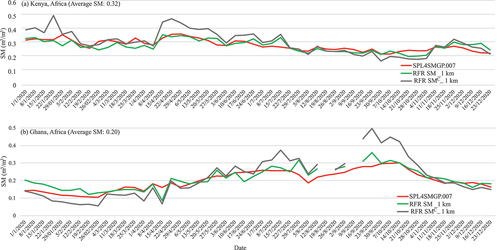
Figure 6. Temporal patterns of the original SMAP product with 9 km resolution, the 1 km SM map retrieved from RFR, and the SM map after applying the correction coefficient EquationEq (3(3)
(3) ) for 2020 with in-situ measurements of the Kenya (a) and Ghana (b) validation sites.
Supplemental Material
Download MS Word (2.1 MB)Data availability statement
All satellite data and products supporting the methodology and findings of this paper (including MODIS and SM Products) have been archived in GEE and are openly available at https://developers.google.com/earth437engine/datasets/catalog/. The field samples of SM over three validation sites, which were used in this study to validate the proposed method, were collected using the ISMN and are available at https://ismn.earth/.