
Figures & data
Figure 1. Adriatic Sea and position of the Secchi disk depth measurements used in this study.
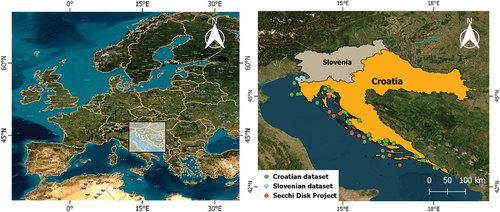
Figure 2. Probability distribution of measured ZSD values in the Croatian, Slovenian, and Secchi disk Project datasets.
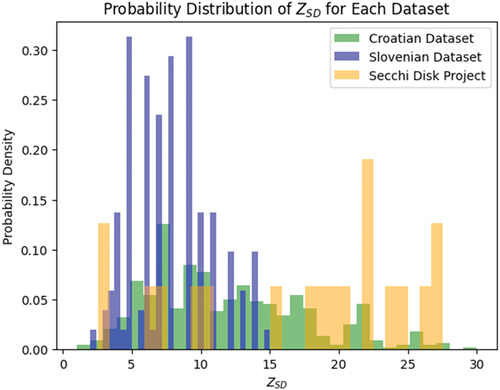
Table 1. Statistical characteristics of in situ ZSD (m) through years.
Figure 3. Cloud and land mask based on band Oa17 values for the area of the Kaštela Bay and Brač Channel (Croatian coast) on August 2, 2020.
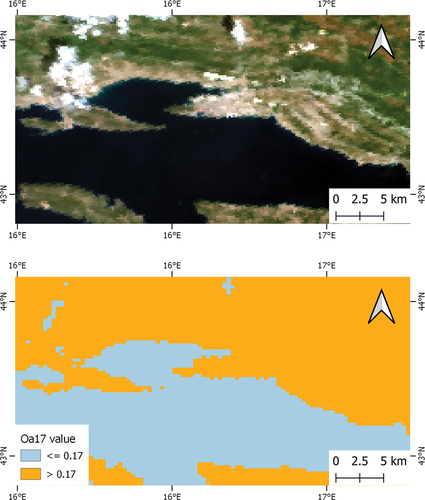
Figure 4. One dimensional data example—Sentinel-3 OLCI TOA reflectances corresponding to in situ Secchi values.
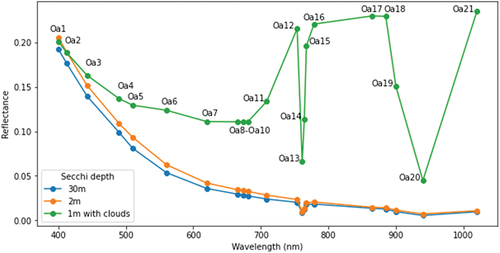
Figure 5. Proposed 1D-CNN architecture for the Secchi disk depth prediction.
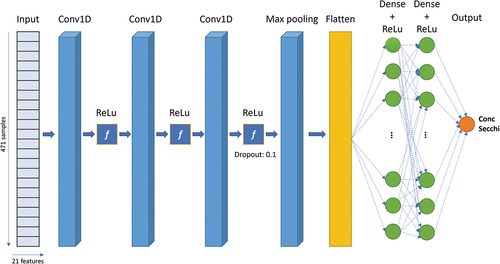
Figure 6. Applied hyperparameters to 1D-CNN model.
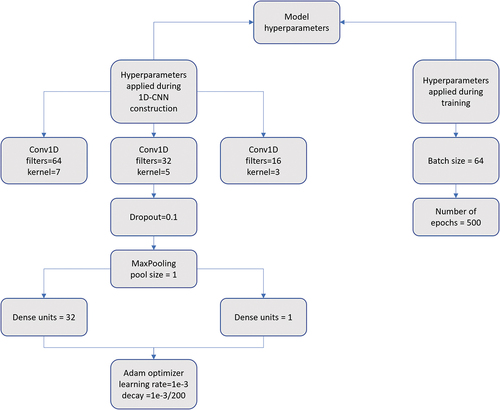
Figure 7. Flowchart of the 1D-CNN model development and evaluation process.
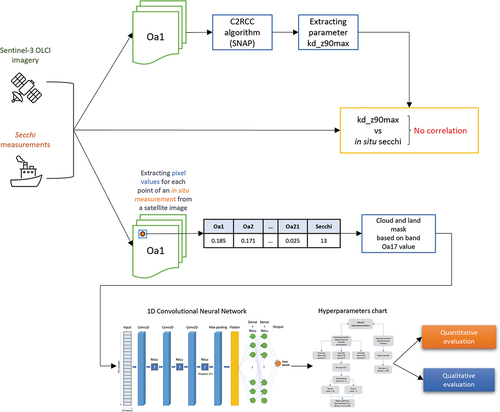
Table 2. Comparison 1D-CNN performance for different datasets.
Figure 8. A prediction error plot shows the difference between the predicted values and the measured values of Secchi depth in meters (m) on the final test dataset.
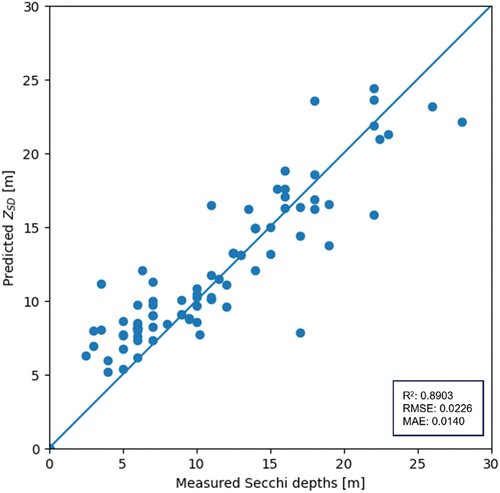
Figure 9. Histogram of errors of 1D-CNN model on the final test dataset.
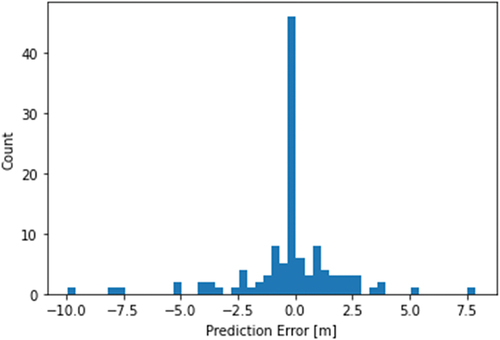
Table 3. Comparison of regression algorithms metrics.
Figure 10. The map illustrates the distribution of Secchi disk depth in the study area on September 3, 2021.
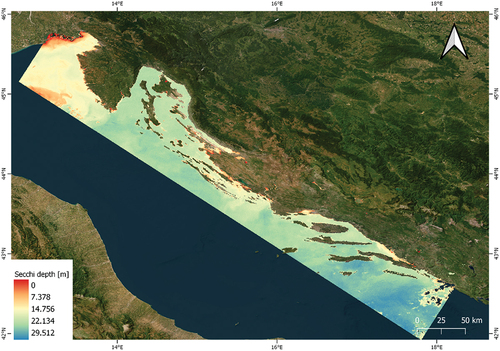
Figure 11. The map illustrates the distribution of kd_z90max in the study region on September 3, 2021, created using the C2RCC processor in SNAP.
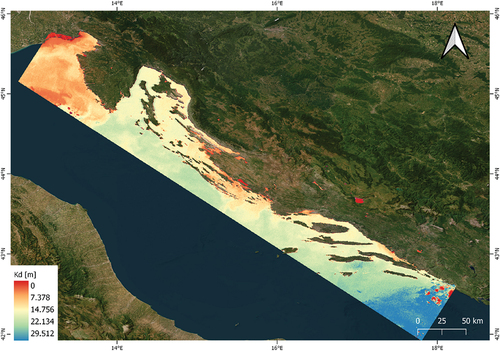
Figure 12. Comparison of Secchi disk depth predictions using in situ measurements, 1D-CNN model, and C2RCC processor based on data from .
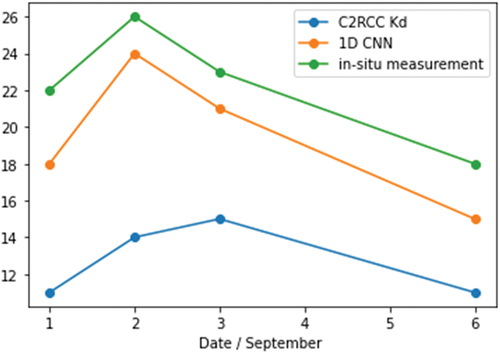
Table 4. Comparison of in situ Secchi depth measurements with kd_z90max predicted values from C2RCC processor and Secchi disk depth from 1D-CNN model.
Data availability statement
The data that support the findings of this study are available from the corresponding author, upon reasonable request.