
Figures & data
Table 1. Multi-altimeter data used in this study.
Table 2. Details of in situ data for 21 lakes used for validation.
Figure 1. Flowchart describing the lake level time series construction process.
Figure 2. The multi-altimeter lake level series in Zhari Namco.
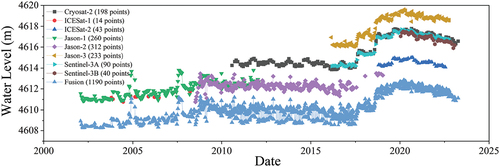
Table 3. Comparison between the lake levels of satellite missions and in situ lake levels.
Figure 3. Comparison of fused lake level series and in situ lake levels (a) Qinghai lake, (b) Tai lake, (c) Gyaring lake, (d) Dongping lake.
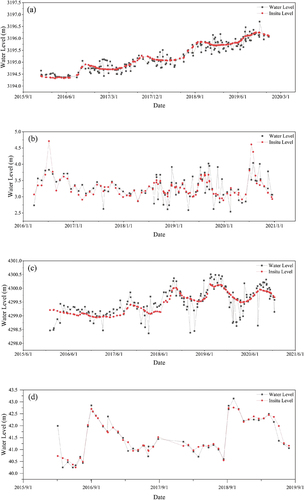
Table 4. Comparison between the multi-source fusion lake levels and in situ lake levels.
Table 5. The trends for changes in lake levels in China during 2002–2023.
Figure 4. Lake level changes in China during 2002–2023 (a) >1000 km2; (b) 500–1000 km2; (c) 100–500 km2; (d) 50–100 km2; (e) 10–50 km2.
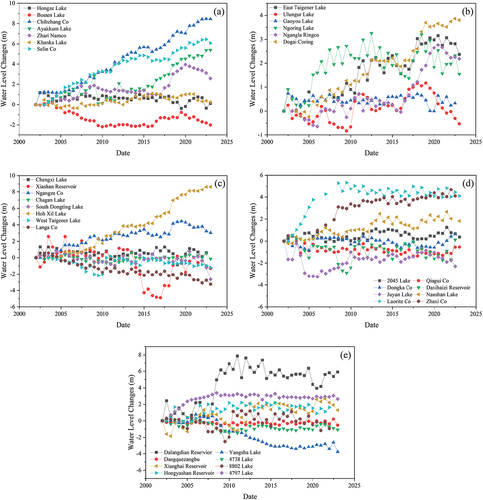
Figure 5. Spatial distribution of lake level change trends in China during 2002–2023. The lowercase letters indicate different lake regions. (a) Northeast plain and Mountain; (b) Eastern Plain; (c) Yunnan–Guizhou Plateau; (d) Inner Mongolia–Xinjiang; (e) Tibetan Plateau.
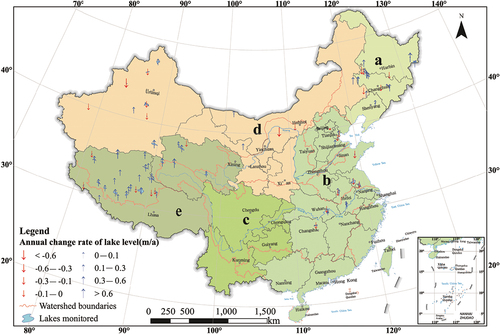
Table 6. The trends of changes in lake levels of different lake regions in China during 2002–2023.
Table 7. The trends for changes in lake levels in China during 2008–2023.
Figure 6. Lake level changes in China during 2008–2023 (the lowercase letters indicate five size classification showed as in ).
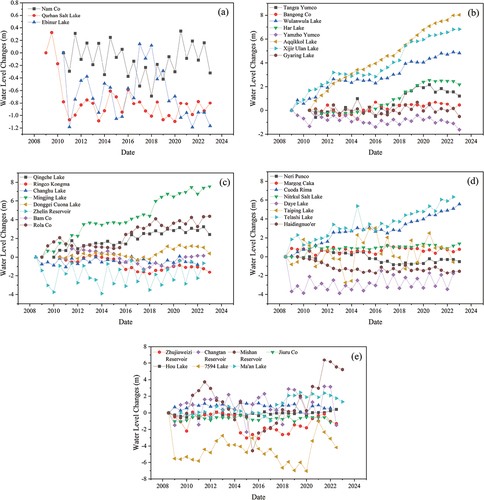
Figure 7. Spatial distribution of lake level change trends in China during 2008–2023 (the lowercase letters indicate the different lake regions shown in ).
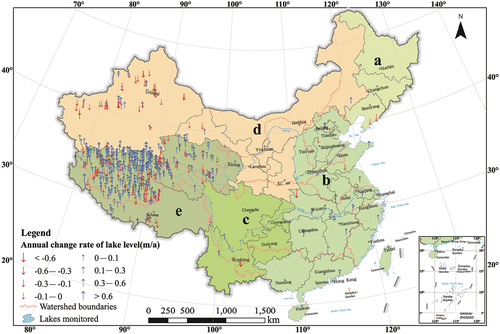
Table 8. The trends for changes in lake levels of different lake regions in China during 2008–2023.
Appendix_1209.docx
Download MS Word (165 KB)Data availability statement
The data that support the findings of this study are openly available in the Science Data Bank at https://doi.org/10.57760/sciencedb.10395