
Figures & data
Figure 1. Study area (a), Köppen climate zoning (b) and wheat planting zoning (c).
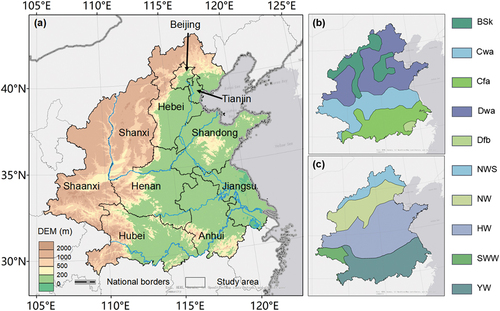
Table 1. Spectral indices used for classification input.
Figure 2. Distribution of field survey samples.
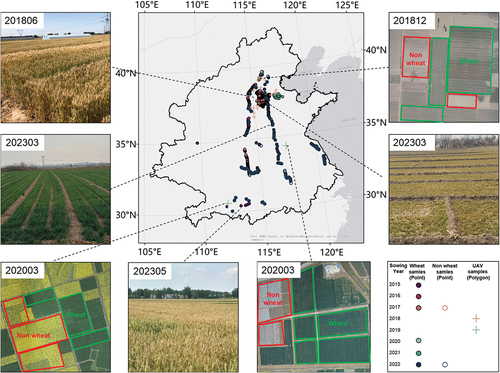
Table 2. Information of field survey samples.
Table 3. Crop mapping products used for sample generation.
Figure 3. The workflow of the proposed winter wheat mapping approach ((a) Sample Generation; (b) Optimal Zoning; (c) Mapping and Validation).
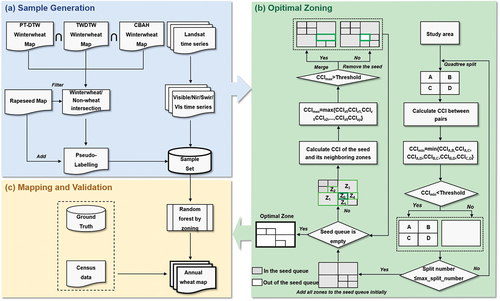
Figure 4. Landsat-8 satellite-based normalized vegetation index (NDVI) time-series variation curves for winter wheat and rapeseed.
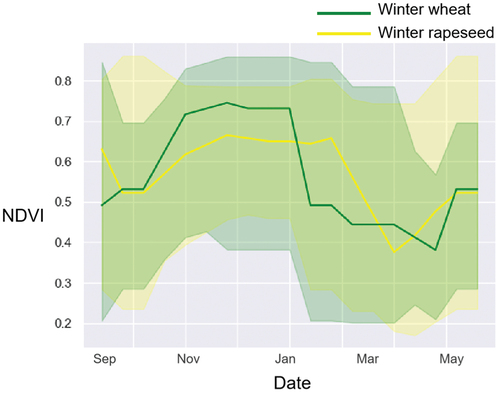
Figure 5. Optimal zoning results and the distribution of training samples in each subzone.
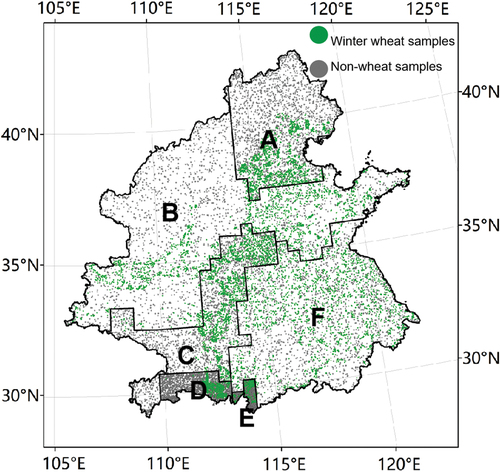
Figure 6. (a) The splitting and the merging process of the study area. (b) The change of classification accuracy (OA) during the splitting and merging process.
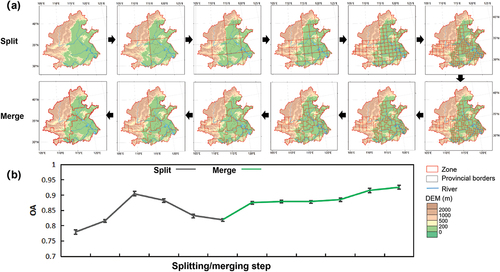
Figure 7. (a) Produced 30 m winter wheat map in 2022; (b) change trend of winter wheat from 2013 to 2022 at 5-km grid. The urban boundary is accessed from He et al. (Citation2019).
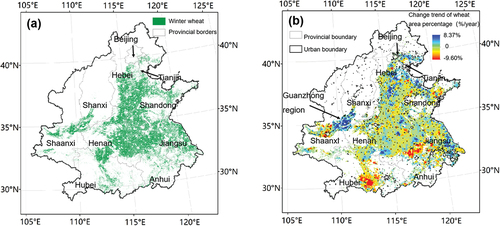
Figure 8. Spatial details of winter wheat maps in different years.
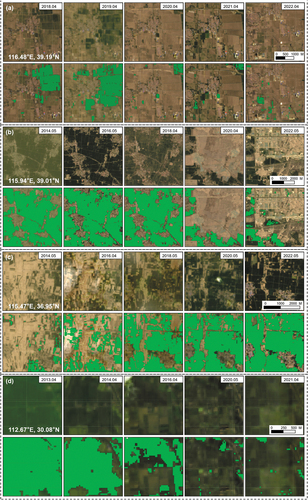
Table 4. The accuracy indices of the winter wheat maps from 2015 to 2023.
Figure 9. The comparison of the mapped area of winter wheat with the census area at the province level during 2013–2020.
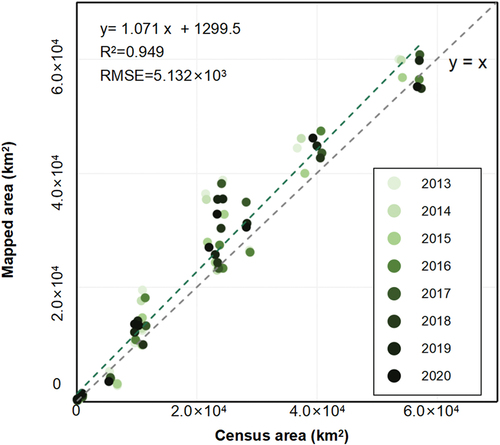
Table 5. Accuracies assessment based on Sentinel-2 derived maps.
Figure 10. Details of winter wheat maps obtained using the optimal zoning method and other methods for the years 2017(a) and 2022(b).
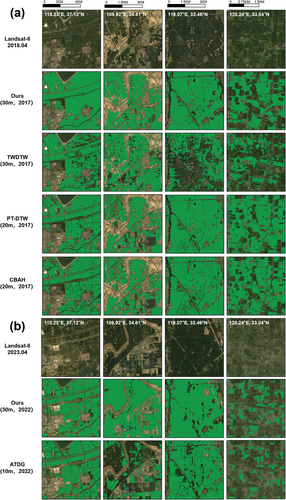
Table 6. Accuracy assessment of the classification results based on different zoning methods. Bold font and underlining indicate the highest and second highest accuracy, respectively.
Table 7. Accuracy improvements of the optimal zoning compared to non-zoning in different subzones.
Figure 11. Different spatial patterns of different zoning results: optimal zoning (a), Köppen climate zoning (b) and wheat planting zoning (c).
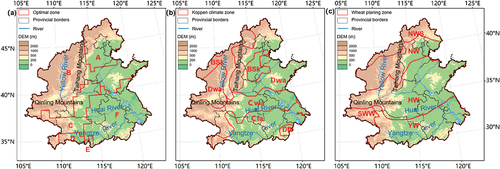
Figure 12. Optimal zoning results based on different CCI thresholds: 0.95 (a), 0.97 (b) and 0.99 (c).
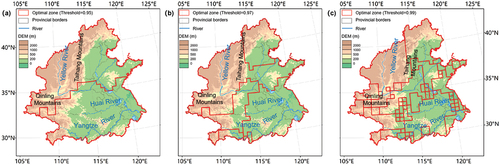
Table 8. Comparison of classification result accuracy of different CCI thresholds. Bold font indicates that accuracy ranks first, and underlining indicates that accuracy ranks second.
Data availability statement
The Landsat-8 data used in this paper are available in GEE. The produced wheat maps are shared in GEE (https://code.earthengine.google.com/0bedafeeb6899c8a92e23a4e64782206?noload=1) and Zenodo (https://doi.org/10.5281/zenodo.10522027).
The validation data in this study are available from the corresponding author, X.H.Chen, upon reasonable request.