Figures & data
Table 1. List of strains
Figure 1. (a) Linear regression graph showing a strain's susceptibility to fluconazole and its FICI indicate a weak negative correlation. (b) Same as (a) but with a strain's susceptibility to sertraline. Filled circles indicate the MIC versus FICI point for individual strains.
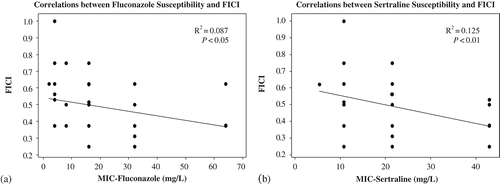
Table 2. Geometric means (range) of the minimum inhibitory concentrations (MIC), fractional inhibitory concentrations (FIC), and fractional inhibitory concentration index (FICI) among the four serotypes of the C. neoformans species complex
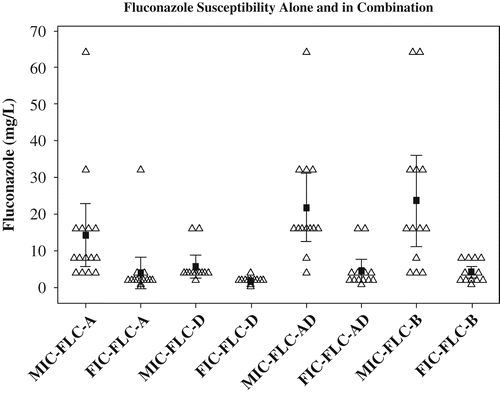
Figure 2. Fluconazole tolerance alone (MIC-FLC) and in the presence of sertraline (FIC-FLC) for each serotype. The serotypes revert to their respective baseline fluconazole susceptibility in the presence of sertraline. The open triangles represent the respective value for individual strains in each category; the filled squares represent the respective mean value for each category with a 95% confidence interval bar.