Figures & data
Figure 1. Map of ITS genotypes successfully sampled for P. praetextata (prae), P. evansiana, and P. canina. (a) In the main sampling site, sampling was concentrated along three limestone ridges containing suitable habitat with some granite erratics. (b) The additional sampling site was located 3.1–3.7 km from the first site. Sampling was conducted along a limestone cliff face at the edge of an alvar and on several granite ridges.
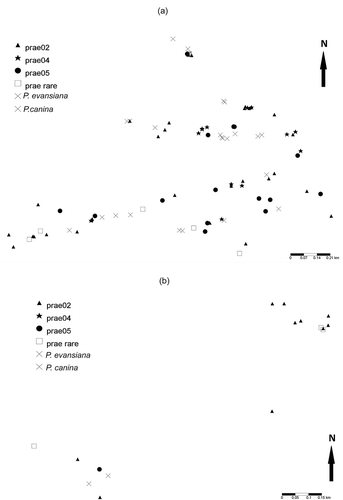
Table 1. Number ITS genotypes found for each of the three Peltigera species present at the main field sites and at outlying locations.
Figure 2. Mutational steps among ITS P. praetextata genotypes. Numbers in each node represent the numbered P. praetextata genotypes (e.g. 2 = prae02). Edges represent one transition; small nodes without numbers represent predicted, unsampled genotypes. Sizes of circles indicate the number of samples with that haplotype (ranging from 1 to 14). Dark shading indicates samples collected at our field sites while light shading indicates samples collected elsewhere (see for details).
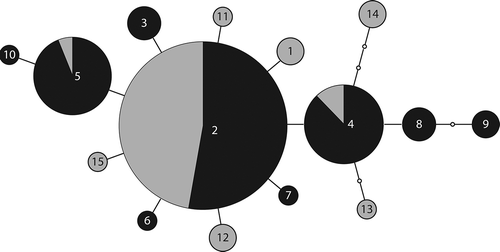
Figure 3. Mutational steps among ITS P. evansiana genotypes. See legend.
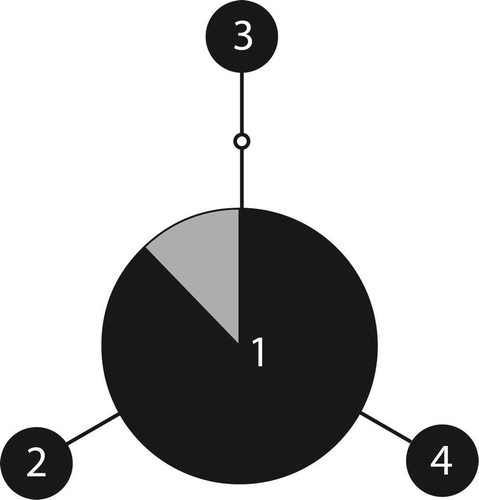
Figure 4. Mutational steps among ITS P. canina genotypes. See legend.
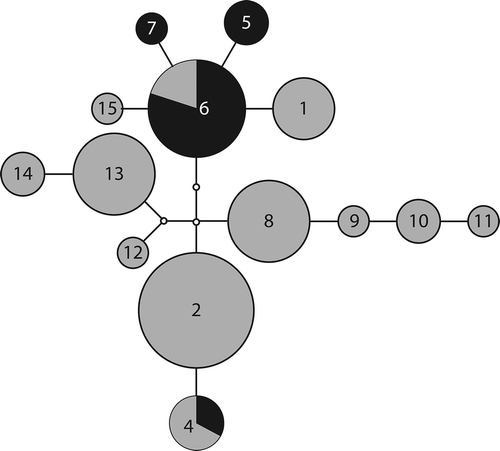
Figure 5. Rarefaction curves with extrapolation for (a), (b) P. praetextata, (c), (d) P. evansiana, (e), (f) P. canina. Species richness (S) is plotted against sampling effort on the left (a), (c), (e), while Chao1 is plotted on the right (b), (d), (f). Dotted lines represent 95% confidence intervals.
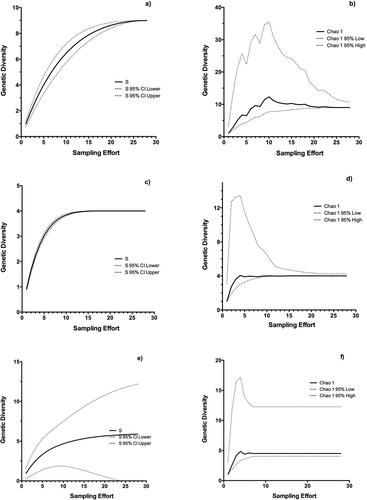
Table 2. Joint-count test and random probability values for P. praetextata for all comparisons. “Rare” refers to all other P. praetextata genotypes that are not prae02,04, or 05.
Table 3. Observed and expected number of P. praetextata genotypes present on each substrate.