Figures & data
Figure 1. Representative micro-bioreactor cultivation plate.
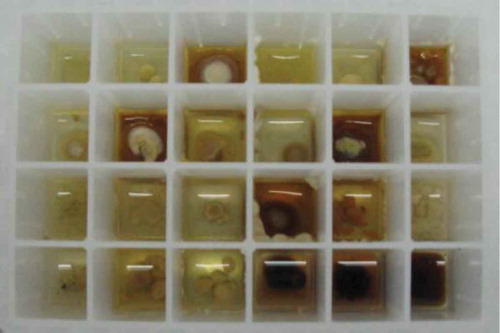
Figure 2. Expansions from the HPLC-DAD-ESIMS chromatograms (254 nm) of EtOAc extracts derived from Penicillium sp. (ACM-4616) cultured for 7 days in SDB broth (a) with and (b) without LPS (0.6 ng/mL). Enhanced and activated metabolites are shown in light and dark grey, respectively.
Figure 3. Metabolites 1−5 produced by LPS-stimulated Penicillium sp. (ACM-4616).
Figure 4. Expansions from the HPLC-DAD-ESIMS chromatograms (254 nm) of EtOAc extracts derived from Penicillium sp. (CMB-TF0411) cultured for 10 days in ISP-2 broth (a) with and (b) without LPS (0.6 ng/mL). Enhanced and activated metabolites are shown in light and dark grey, respectively.
Figure 5. Metabolites produced by LPS-stimulated Penicillium sp. (CMB-TF0411).
Figure 6. Expansions from the HPLC-DAD-ESIMS chromatograms (254 nm) of EtOAc extracts derived from Aspergillus sp. (CMB-M81F) cultured for 120 days in M1 broth with 3.3% artificial ocean sea salt (a) with and (b) without LPS (0.6 ng/mL). Enhanced and activated metabolites are shown in light and dark grey, respectively.
Figure 7. Metabolites produced by LPS-activated Aspergillus sp. (CMB-M81F).
Figure 8. Expansions from the HPLC-DAD-ESIMS chromatograms (254 nm) of EtOAc extracts derived from Aspergillus niger (ACM-4993F) cultured for 10 days in ISP-2 broth (a) with and (b) without LPS (0.6 ng/mL). Activated metabolites are shown in dark grey.
Figure 9. Expansions from the HPLC-DAD-ESIMS chromatograms (254 nm) of EtOAc extracts derived from Rhizopus oryzae (ACM-165F) cultured for 10 days in ISP-2 broth (a) with and (b) without LPS (0.6 ng/mL). Enhanced and activated metabolites are shown in light and dark grey, respectively.
Figure 10. Expansions from the HPLC-DAD-ESIMS chromatograms (254 nm) of EtOAc extracts derived from Thanatephorus cucumeris (ACM-194F) cultured for 10 days in ISP-2 broth (a) with and (b) without LPS (0.6 ng/mL). Activated metabolites are shown in dark grey.
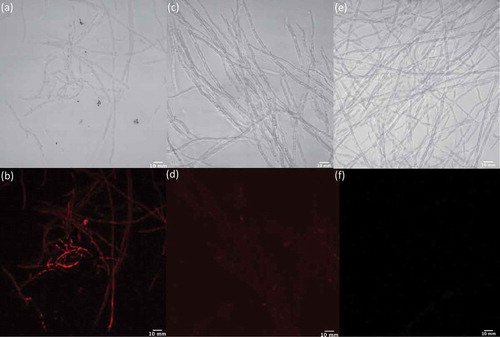
Figure 11. Light and fluorescence microscopy images of Penicillium sp. (ACM-4616) cells exposed to an NO detection kit in the presence (a/b) and absence (e/f) of LPS and in the presence of LPS and an NO quenching agent (c/d).
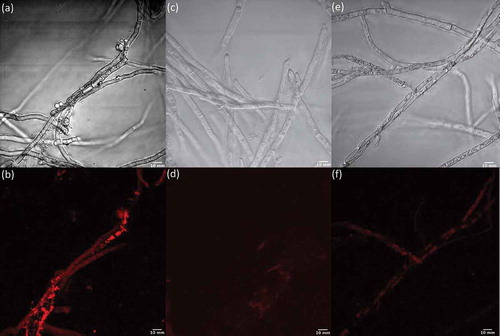
Figure 12. Light and fluorescence microscopy images of Penicillium sp. (CMB-TF0411) cells exposed to an NO detection kit in the presence (a/b) and absence (e/f) of LPS and in the presence of LPS and an NO quenching agent (c/d).