Figures & data
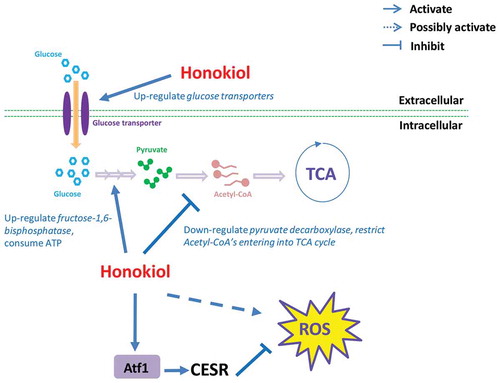
Figure 1. Honokiol can inhibit the cell growth of fission yeast. (a) The yeast growth inhibition curve under different doses of honokiol (0, 1, 2, 3, 4, 6 and 8 μg/ml). Cell growth rates were measured as described in “Materials and methods” section. (b) Phase contrast microscopic analysis of yeast cell shape: 3 μg/ml honokiol and mock reagent (ethanol) were used to treat the yeast cells for 4 h. The white bar represents the length of 10 μm. The white arrow shows the cell with abnormal phenotype. (c) Calcofluor staining to visualise the cell septum: 3 μg/ml honokiol and mock reagent (ethanol) were used to treat the yeast cells for 4 h. The white bar represents the length of 10 μm. The white arrow shows the cell with abnormal phenotype. (d) FACS analysis to check honokiol’s effect on cell cycle: 3 μg/ml honokiol was used to treat the cells for 0, 2 and 4 h.
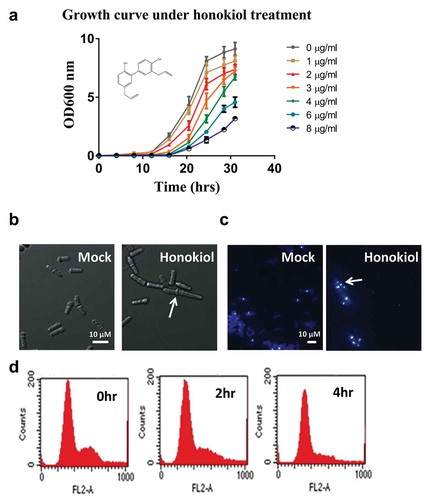
Table 1. The gene set enrichment analysis of the honokiol up-regulated genes.
Figure 2. Honokiol-induced transcriptomic change is closely related to core environmental stress response. IC50 value honokiol (3 µg/ml) and vehicle control were added to YE medium cultured yeast at OD600 = 0.2. Next, the cells were incubated for 4 h. Afterwards, the cells were collected and mRNA was extracted for the microarray analysis. The detailed data analysis is described in “Materials and methods” section. Basically, the data used in clustering analysis were selected by both the fold change (>2 folds) and p-value (<0.05). Honokiol-1, -2, -3 represent three biological replicates. Other stress treatment conditions are reported before (Dongrong et al. Citation2003). Briefly, these stress conditions include: oxidative stress (0.5 mM H2O2, treat 15 and 60 min), heavy metal stress (0.5 mM CdSO4, treat 15 and 60 min), heat stress (39°C, treat 15 and 60 min), osmotic stress (1 M sorbitol, treat 15 and 60 min) and alkylating agent (0.2%, w/v methylmethane sulfonate, treat 15 and 60 min).
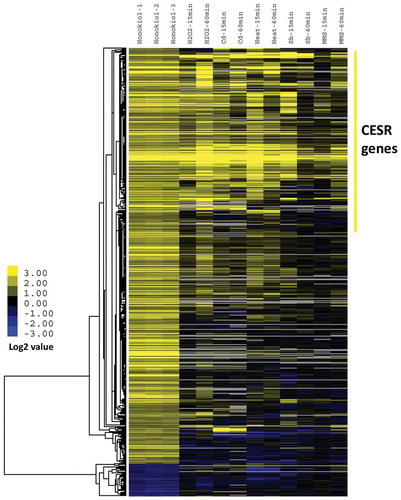
Figure 3. Network analysis of honokiol up-regulated gene sets indicates extensive protein–protein interactions are existed and form biofunctionally important modules. The predicted interactions are retrieved with scores >0.5 based on the support vector machine and random forest algorithm. The red circles represent the candidate proteins, the grey lines represent the predicted interaction, the green lines represent the interactions has experimental evidences. The line’s thickness represents the relative possibilities of the interaction event.
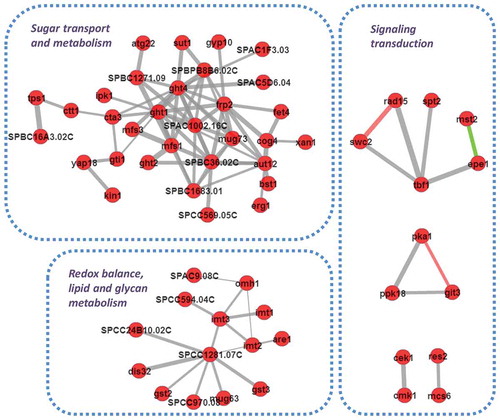
Figure 4. The honokiol’s transcriptional regulation on fermentation module. The metabolic structure was drawn based on the KEGG (http://www.genome.jp/kegg/). For the metabolic enzymes (brown fonts, italics), their relative expression level after honokiol treatment are shown as numbers (red fonts represent up-regulated genes, which changes >20%; green fonts represent down-regulated genes, which changes >20%) in parallel. The abbreviations of these metabolic enzymes represent: PGI1 (glucose-6-phosphate isomerase), FBA1 (fructose-bisphosphate aldolase), FBP1 (fructose-1,6-bisphosphatase), TDH1 (glyceraldehyde-3-phosphate dehydrogenase), PGK1 (phosphoglycerate kinase), ENO1 (enolase), PYK1 (pyruvate kinase), PDA1 (pyruvate dehydrogenase E1 component alpha subunit), PDB1 (pyruvate dehydrogenase E1 component beta subunit), PDC (pyruvate decarboxylase), CIT1 (citrate synthase), ACO1 (aconitate hydratase), IDH1 (isocitrate dehydrogenase), IDH2 (isocitrate dehydrogenase), KGD1 (2-oxoglutarate dehydrogenase), SDH1 (succinate dehydrogenase), SDH2 (succinate dehydrogenase), FUM1 (fumarate hydratase), MDH1 (malate dehydrogenase). For the metabolites (red fonts), these abbreviations represent: glucose-6-P (glucose 6-phosphate), fructose-6-P (fructose 6-phosphate), FBP (fructose 1,6-bisphosphate), G3P (glyceraldehyde 3-phosphate), 1,3 BPG (glycerate 1,3-diphosphate), PG (phosphoglycerate), PEP (phosphoenolpyruvate), PYR (pyruvate), Acetyl-CoA (acetyl coenzyme A), CIT (citrate), ISOCIT (iso-citrate), α-KG (alpha-ketoglutarate), SUC (succinate), FUM (fumarate), MAL (malate), OAA (oxaloacetate).
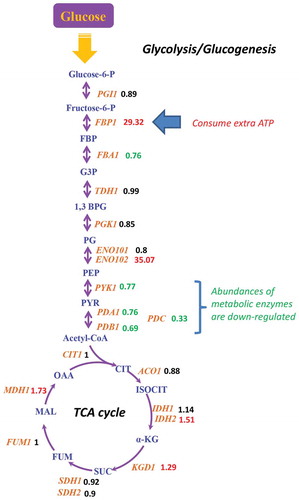
Figure 5. The mode-of-action of honokiol caused antifungal activity in fission yeast. As shown in this figure, honokiol can up-regulate a series of glucose transmembrane transporters, thus increase the glucose uptake rate. Honokiol can greatly up-regulated fructose 1,6-bisphosphate, which consumes much more ATP to produce fructose 1,6-bisphosphate. However, honokiol also significantly down-regulates pyruvate decarboxylase, which restricts the flux entering into TCA cycle, and removes waste of the previous ATP molecules as well. At the same time, honokiol can widely trigger the overexpression of many CESR genes. Although above event may represent cell’s self-adaptation to the ROS stress (many are mediated by transcription factor Atf1), but the long-termed dysregulation of CESR may also disrupt the redox homeostasis, which is harmful to the viability of cell.